[CT] Smart Supertrend Smart Supertrend is an overlay trend and context indicator that combines three different ideas into one visual: a dynamic “cloud” that adapts to market cycle speed, a pivot-point anchored trailing line that behaves like a smarter Supertrend, and an ADX strength filter that helps separate real trends from noisy sideways movement. It is designed to keep you aligned with the dominant direction while giving you a clean framework for entries, pullbacks, and exits.
The “cloud” is the heart of the script’s regime read. Internally, it builds an adaptive smoothing engine that reacts to how efficiently the price is moving. When the price is moving in a clean, directional way, the cloud becomes more responsive. When the price is choppy and overlapping, the cloud becomes slower and steadier. The cloud itself is drawn as two lines, Cloud A and Cloud B, and the filled area between them. When the adaptive KAMA slope is rising, the cloud is treated as bullish and uses your Up color. When it is falling, the cloud is treated as bearish and uses your Down color. This creates a quick visual of whether the market is behaving like an uptrend regime or a downtrend regime without relying on one fixed moving average length that can be too fast in chop or too slow in trend.
The PP line is the trade management spine. It is built from pivot logic that detects meaningful swing highs and swing lows using your PP Period. Those pivots are blended into a centerline, and then an ATR band is applied around that center using your ATR Period and ATR Factor. That band is turned into a trailing line that “ratchets” in the direction of the current trend. When the price is above the trailing logic, the script considers the trend state to be long. When the price is below, it considers the trend state to be short. The reason this feels different from a basic Supertrend is that the anchor comes from pivots and smoothing rather than only a direct ATR band around price, so it tends to track structure more naturally and reduce some of the fast flipping you see in choppy sections.
The ADX filter is the quality control layer. It computes plus DI, minus DI, and ADX over your ADX Length, and then checks whether ADX is above your threshold. When ADX is above the threshold, it suggests the market is trending enough for trend signals to matter. When ADX is below the threshold, the script is telling you the environment is more sideways, which is where most trend systems get chopped up. In the original logic, the “best” conditions occur when the cloud direction agrees with the DI direction, and ADX is strong, because that means direction and strength are aligned.
How you trade it starts with using the cloud as your directional bias. When the cloud is bullish, you prioritize longs and you treat shorts as lower quality or countertrend. When the cloud is bearish, you prioritize shorts and you treat longs as lower quality. Next, you use the PP line as the “line in the sand” for trend state and risk placement. In a bullish environment, price holding above the PP line is your confirmation that the structure-anchored trailing level is supporting the move. In a bearish environment, price holding below the PP line is your confirmation that the trailing level is capping rallies.
A clean, practical entry approach is to wait for agreement between the cloud and the PP line, then take pullbacks into that framework. For long trades, the highest quality setups occur when the cloud is bullish, the PP line is below price, and ADX is above the threshold with plus DI leading minus DI. In that state, you can look for pullbacks that dip toward the PP line or into the cloud region and then reject back upward, because you’re buying a retracement inside a confirmed trend regime rather than chasing extension. For short trades, the mirror applies: the cloud is bearish, the PP line is above price, ADX is above the threshold with minus DI leading, and you sell rallies back into the PP line or cloud that fail and rotate down.
Stops and exits can be built around the PP line because it is already an ATR-based trailing structure level. For a long, a conservative stop is placed just below the PP line with a buffer related to ATR, because if price closes and holds below that line you are likely seeing a trend condition break. For a short, the stop goes just above the PP line with a similar buffer. For profit taking, many traders scale out when price stretches far away from the PP line or when the cloud begins to lose slope and compress, because that often signals trend momentum is slowing. Another simple exit rule is to reduce or close when the PP line flips trend state against your position, or when the ADX falls back under the threshold after a run, because that frequently marks a transition into consolidation where trailing systems can give back gains.
If you enable signals in versions that plot them, the logic is meant to highlight moments when the PP line flips trend and the cloud is not contradicting that flip, then further filters those into “higher quality” conditions when cloud direction and ADX trend strength agree. In practice, you should still treat signals as prompts, not automatic trades. The best results come from using the signal as a timing cue while you still enforce the bigger rule of alignment: cloud direction, PP line trend state, and ADX strength all pointing the same way, with entries taken on pullbacks rather than on late breakout candles.
Finally, be aware that all adaptive smoothing systems will look different across markets and timeframes, so the main tuning knobs are your Cloud Length, PP Period, ATR Factor, and ADX Threshold. If you want fewer flips and more “position trading” behavior, increase the ATR Factor and consider a higher ADX threshold. If you want earlier entries and more sensitivity, lower ATR Factor and lower the threshold, but expect more chop. The indicator is at its best when you treat it as a regime and structure tool: let the cloud tell you the side, let the PP line define where you are wrong, and let ADX decide whether it’s a trend day or a chop day before you commit size.
Search in scripts for "swing high"

Sentinel Market Structure [JOAT]
Sentinel Market Structure - Smart Money Structure Analysis
Introduction and Purpose
Sentinel Market Structure is an open-source overlay indicator that identifies swing highs/lows, tracks market structure (HH/HL/LH/LL), detects Break of Structure (BOS) and Change of Character (CHoCH) signals, and marks order blocks. The core problem this indicator solves is that retail traders often miss structural shifts that smart money traders use to identify trend changes.
This indicator addresses that by automatically tracking market structure and alerting traders to key structural breaks that often precede significant moves.
Why These Components Work Together
Each component provides different structural information:
1. Swing Detection - Identifies significant pivot highs and lows. These are the building blocks of market structure.
2. Structure Labels (HH/HL/LH/LL) - Classifies each swing relative to the previous swing. Higher Highs + Higher Lows = uptrend. Lower Highs + Lower Lows = downtrend.
3. Break of Structure (BOS) - Identifies when price breaks a swing level in the direction of the trend. This is a continuation signal.
4. Change of Character (CHoCH) - Identifies when price breaks a swing level against the trend. This is a potential reversal signal.
5. Order Blocks - Marks the last opposing candle before an impulse move. These zones often act as future support/resistance.
How the Detection Works
Swing Detection:
bool swingHighDetected = high == ta.highest(high, swingLength * 2 + 1)
bool swingLowDetected = low == ta.lowest(low, swingLength * 2 + 1)
BOS vs CHoCH Logic:
// BOS: Break in direction of trend (continuation)
bool bullishBOS = close > lastSwingHigh and marketTrend >= 0
// CHoCH: Break against trend (reversal signal)
bool bullishCHOCH = close > lastSwingHigh and marketTrend < 0
Order Block Detection:
bool bullOB = close < open and // Previous candle bearish
close > open and // Current candle bullish
close > high and // Breaking above
(high - low) > ta.atr(14) * 1.5 // Strong impulse
Signal Types
HH (Higher High) - Swing high above previous swing high (bullish structure)
HL (Higher Low) - Swing low above previous swing low (bullish structure)
LH (Lower High) - Swing high below previous swing high (bearish structure)
LL (Lower Low) - Swing low below previous swing low (bearish structure)
BOS↑/BOS↓ - Break of structure in trend direction (continuation)
CHoCH↑/CHoCH↓ - Change of character against trend (potential reversal)
Dashboard Information
Trend - Current market bias (BULLISH/BEARISH/NEUTRAL)
Swing High - Last swing high price with HH/LH label
Swing Low - Last swing low price with HL/LL label
Structure - Current structure state (HH+HL, LH+LL, etc.)
Price - Price position relative to structure
How to Use This Indicator
For Trend Following:
1. Identify trend using structure (HH+HL = uptrend, LH+LL = downtrend)
2. Enter on BOS signals in trend direction
3. Use swing levels for stop placement
For Reversal Trading:
1. Watch for CHoCH signals (break against trend)
2. Confirm with order block formation
3. Enter on retest of order block zone
For Risk Management:
1. Place stops beyond swing highs/lows
2. Use structure lines as trailing stop references
3. Exit when CHoCH signals against your position
Input Parameters
Swing Detection Length (5) - Bars on each side for pivot detection
Show Swing High/Low Points (true) - Toggle swing markers
Show BOS/CHoCH (true) - Toggle structural break signals
Show Structure Lines (true) - Toggle horizontal swing lines
Show Order Blocks (true) - Toggle order block zones
Zone Extension (50) - How far order block boxes extend
Timeframe Recommendations
15m-1H: Good for intraday structure analysis
4H-Daily: Best for swing trading structure
Lower timeframes require smaller swing detection length
Limitations
Swing detection has inherent lag (needs confirmation bars)
Not all BOS/CHoCH signals lead to continuation/reversal
Order block zones are simplified (not full ICT methodology)
Structure analysis is subjective - different traders see different swings
Open-Source and Disclaimer
This script is published as open-source under the Mozilla Public License 2.0 for educational purposes.
This indicator does not constitute financial advice. Market structure analysis does not guarantee trade outcomes. Always use proper risk management.
- Made with passion by officialjackofalltrades

Tahir's Dual MTF order blocks Order Blocks + Swing Levels (Dual MTF, Fixed, Extended, NoAutoClose)
This tool combines smart orderblock detection with swinghigh / swinglow validation, designed for traders who want precise, rulebased zone plotting without repainting tricks or automatic deletion of historical levels.
🔥 What this indicator does
1️⃣ Detects Order Blocks Across Multiple Timeframes
It automatically finds bullish & bearish order blocks using three layers:
Current timeframe OBs
Higher Timeframe 1 (custom selectable)
Higher Timeframe 2 (custom selectable)
Each layer is colorcoded so you instantly know where institutional zones exist.
Order blocks remain extended forward until price fills them, giving a realistic market structure map.
2️⃣ Keeps Zones Until They Are Truly Filled
Unlike many scripts that autodelete boxes, this version:
✔️ Extends zones to the right
✔️ Tracks “active” vs. “filled” OBs
✔️ Prevents unnecessary removal
This allows proper backtesting and historical reference.
3️⃣ SwingHigh & SwingLow Confirmation
The script overlays SWL/SWH labels to identify pivot turning points.
An order block becomes a validated zone when:
Bullish OB + Swing Low (SWL)
Bearish OB + Swing High (SWH)
Validated zones are highlighted with special colors:
🟩 Lime = Valid Bullish OB
🟪 Fuchsia = Valid Bearish OB
This filters out weak zones and highlights only strong price bases.
4️⃣ DualTimeframe Logic
You can enable/disable each timeframe independently:
HTF1 (e.g., 1H)
HTF2 (e.g., 4H)
Current chart timeframe
This gives flexibility for scalpers, swing traders, and position traders.
5️⃣ Optimized & Debugged
The script has:
Memory controls (limits stored boxes)
Stable boxextension logic
No repainting structure logic
Clearly separated and readable functions
Everything is optimized to avoid lag while handling many OB zones.
⚙️ Key Inputs
Show Long / Short OBs
Enable HTF1 & HTF2
Custom timeframes
Swing detection length
Memory limit for stored zones
📌 UseCases
Institutional trading models
Smartmoney concepts
Supply & demand zone trading
Confluence with entries (FVG, BOS, RSI, etc.)
This indicator is a visual decisionsupport tool — not a buy/sell signal system.
⚠️ Disclaimer
This script does not repaint, but trading always carries risk.
Use alongside price action and risk management.

deKoder | Whale Prints [WP]deKoder | Whale Prints | Large Trade Orderflow Detection
This open-source indicator is a clean, precision tool for revealing hidden large-volume activity directly on your chart. By scanning ultra-low timeframes while you view higher ones, it projects statistically significant volume spikes as intuitive markers giving you a clear window into institutional orderflow without visually overwhelming the price action.
Key Features & Strengths
True Intra-Bar Detection | Monitors lower timeframes down to 1-second bars, catching aggressive block trades and absorption that occur within a single higher-TF candle.
Accurate Trade Levels | Markers are placed at the actual hl2 price of the aggressive lower-TF bar, providing a far more accurate estimate of where the large trade executed than typical mid-candle approximations.
Multiple Trades Per Bar | If several significant volume spikes occur inside one higher-TF candle, all qualifying levels are displayed individually – offering greater granularity and context.
Adaptive Thresholding | Uses higher-TF volume standard deviation (stable baseline) intelligently scaled to the lower timeframe, reducing noise in quiet markets while remaining sensitive to genuine outliers.
Clean Visual Hierarchy | Three tiers (Small 🞉 / Medium ⏣ / Large 🞊) with dynamic symbol size, line thickness, transparency, and user-definable bullish/bearish coloring based on LTF candle direction.
How to Use It as an Orderflow Tool
Large volume spikes often mark the footprints of institutional players. This indicator helps you read those footprints in real time.
Small (🞉) | Moderate excess volume: early interest, probing, or building positions.
Medium (⏣) | Strong spike: increasing conviction, potential momentum shift.
Large (🞊) | Extreme outlier: frequently climactic volume signalling exhaustion or major absorption.
Why Price Often Reverses at These Levels
Large players frequently place limit orders in areas rich with liquidity – commonly just beyond recent highs/lows where retail stop-losses cluster. When price sweeps those zones:
Stop hunts trigger a cascade of forced exits, creating liquidity for larger participants to fill their limit orders.
Breakout traders who entered on the move are trapped offside and become forced buyers/sellers when price reverses.
Institutions use this liquidity to execute large orders at favorable prices with minimal immediate market impact.
The result is aggressive volume at the extreme, followed by reversal as smart money finishes filling and price returns toward fair value. Clusters of medium/large markers at swing points are classic signs of this dynamic.
Practical Analysis Tips
Reversals/Absorption | Clusters of large markers at swing highs/lows (especially opposing-color spikes) signal potential turns – buyers or sellers stepping in aggressively.
Level Defense | Trades piling up at key support/resistance suggest institutions protecting or building positions.
Trapped Traders | Large spikes beyond range pivots followed by reversal back into the range often highlight trapped breakout traders who add fuel to a move when they are forced to liquidate their positions.
Use Offset (-3 to +3) to shift markers away from current price for clearer viewing.
Pro tip: Zoom into the lower TF occasionally to see how these projected levels align exactly with aggressive candles.
Recommended Pairings
This is designed as a pure orderflow overlay to be layered with your existing setup:
Support & Resistance (horizontals, pivots, Volume Profile POC/VAH/VAL)
Market Structure tools (swing points, order blocks, fair value gaps)
Trend filters (EMAs, SuperTrend, higher-TF bias)
Momentum oscillators for timing confluence
Best Suited For
Scalping & day trading (1–15 min charts with 5–30S lower TF)
Swing trading entries (1H–4H charts with 1–5 min lower TF)
High-liquidity markets: crypto perpetuals, forex majors, volatile stocks
Add this indicator to start seeing the hidden aggression driving price and expose the hidden edges beyond the noise.
☠ FR33FA11 | deKoder ☠
Released January 2025 | Open Source

Trend lines & Pressure Zone Overview
This indicator intelligently identifies and plots dynamic support and resistance zones based on swing pivots and price action validation. It combines trend analysis with pressure zone detection to highlight key areas where price is likely to react.
Key Features
1.Smart Zone Detection
Automatically identifies the strongest resistance and support levels
Requires multiple price touches for validation (configurable)
Plots only the 2 most relevant trendlines to keep charts clean
Dynamic channel zones show the area of influence around each trendline
2.Dual Analysis Method
Uses swing pivot detection to find turning points
Validates zones through touch counting with price margin tolerance
Combines aspects of trendline analysis and pressure zone theory
Adapts to different timeframes and instruments
3.Contact Detection & Alerts
Visual circle markers when price contacts zones
Arrow indicators for zone interactions
Alert conditions for zone creation, breaks, and contacts
Customizable visual feedback
4.Flexible Configuration
Adjustable swing length for pivot detection
Configurable price margin tolerance
Minimum touch requirements prevent false signals
Optional line extension with custom length
Peak reset interval to refresh zones periodically
How It Works
Resistance Zones:
Identifies swing high pivots
Tracks the highest peak within the reset interval
When price drops below the peak, draws a downward trendline
Validates the zone by counting touches within the price margin
Only displays the zone after minimum touches are confirmed
Support Zones:
Identifies swing low pivots
Tracks the lowest trough within the reset interval
When price rises above the trough, draws an upward trendline
Validates the zone by counting touches within the price margin
Only displays the zone after minimum touches are confirmed
Zone Channels:
Each trendline includes a parallel channel showing the pressure zone width, making it easier to identify when price is interacting with the zone.
Pivot Detection:
Swing Length (default: 5) - Bars on each side to confirm pivot points
Peak Reset Interval (default: 100) - Bars before resetting tracked peak/trough
Zone Settings:
Price Margin % (default: 0.1%) - Tolerance for touch validation
Minimum Touches (default: 3) - Required touches before drawing zone
Channel Width % (default: 0.5%) - Visual width of pressure zone
Extension:
Extend Lines (default: off) - Project lines into the future
Extension Length (default: 50) - Bars to extend when enabled
Visual Styling:
Separate color/width controls for resistance and support
Customizable fill transparency for channels, Toggle contact arrows and circles
Trading Applications
Entry Signals:
Buy when price contacts support zone with confirmation
Sell when price contacts resistance zone with confirmation, Look for zone breaks as momentum signals
Stop Loss Placement:
Place stops beyond the opposite zone, Use channel width to gauge volatility
Target Setting:
Opposite zone acts as first profit target, Zone breaks signal potential trend continuation
Confluence:
Works well with volume analysis,Combine with RSI/MACD for confirmation,
Use multiple timeframes for stronger signals
Best Practices
✅ DO:
Adjust swing length based on timeframe (lower for intraday, higher for daily+)
Reduce minimum touches (2-3) for volatile markets
Increase price margin for choppy conditions
Wait for candle close confirmation on zone breaks
❌ DON'T:
Trade zones in isolation without other confirmation
Use overly tight parameters that generate false signals
Ignore the broader trend context
Chase price after zone breaks without pullback
Tips for Optimization
Scalping (1-5 min): Swing Length: 3-5, Min Touches: 2
Day Trading (15-60 min): Swing Length: 5-10, Min Touches: 3
Swing Trading (4H-Daily): Swing Length: 10-20, Min Touches: 3-4
Position Trading (Daily-Weekly): Swing Length: 15-25, Min Touches: 4-5
Alert Conditions
Zone Contact: Price touches resistance or support zone
Set up notifications for real-time trading opportunities
Disclaimer: This indicator is for educational and informational purposes only. It should not be considered financial advice. Always perform your own analysis and risk management before trading.

Supply and Demand Zones [Clean v6]Overview
The Supply and Demand Zones indicator is an automated market structure tool designed to identify high-probability Points of Interest (POI) on any asset or timeframe. Built using Pine Script v6, this script focuses on clarity and performance, providing traders with a clutter-free view of where institutional buying and selling pressure has previously occurred.
Unlike crowded indicators that overwhelm the chart, this script dynamically manages zones—drawing new ones as structure forms and automatically removing invalid zones as price breaks through them.
Key Features
Automated Zone Detection: Automatically identifies Supply (Resistance) and Demand (Support) zones based on Swing Highs and Swing Lows.
Dynamic Zone Management: Active zones extend to the right until price interacts with them.
Break of Structure (BOS) Logic: When price violates a zone (closes beyond the invalidation level), the zone is automatically removed and marked as "Broken" to keep the chart clean.
Zig Zag Structure: Includes an optional Zig Zag overlay to visualize market flow, Higher Highs, and Lower Lows.
ATR-Based Sizing: Zone width is calculated using the Average True Range (ATR), ensuring zones adapt to the asset's current volatility.
Pine Script v6: Optimized using the latest array and method functions for speed and stability.
How It Works
Zone Creation: The script looks for Pivot Highs and Lows based on your defined Swing Length.
Supply Zones: Created at Swing Highs.
Demand Zones: Created at Swing Lows.
Zone Width: The height of the box is determined by the ATR multiplied by your Zone Width setting. This ensures the zone covers the "wick" area or the volatility range of the pivot.
Invalidation: If the price closes past the outer edge of a zone (the top of a Supply zone or bottom of a Demand zone), the script detects a break, removes the filled box, and leaves a subtle trace of the broken structure.
How to Use
Trend Following: Use the Zig Zag lines to identify the trend direction. Look for Long entries in Demand zones during an uptrend, and Short entries in Supply zones during a downtrend.
Reversals: Watch for price to react at older, unfilled zones (POIs) that align with major support/resistance levels.
Stop Loss Placement: The outer edge of the zone acts as a natural invalidation point. If price closes beyond it, the setup is typically invalidated.
Settings Guide
Swing Length: Determines the sensitivity of the pivot detection. Lower numbers find more local zones (scalping); higher numbers find major structural zones (swing trading).
Max Zones to Keep: Limits the number of historic zones displayed to prevent chart clutter.
Zone Width (ATR): Adjusts how thick the zones are. Increase this value if you want to capture wider wicks.
Visual Settings: Fully customizable colors for Supply, Demand, Borders, and Zig Zag lines.
Disclaimer
This tool is for informational and educational purposes only. It visualizes past price action and does not guarantee future performance. Always manage your risk appropriately.

EMA and Dow Theory Strategies V2 DOGE Current Optimum Value
📘 Overview
These are the current optimal values for DOGE.
They are intended for use on the 2‑hour timeframe.
This script requires complex configuration, but there is an optimal set of values somewhere.
Here, I’m sharing the settings that I personally use at the moment.
Turning Take Profit off can lead to higher profits, but it also increases risks such as a lower win rate.
With Take Profit on, you can adjust the settings by increasing the values.
I have been trading using Dow Theory for many years.
Trading with Dow Theory and EMA has been my main strategy.
Although it has been profitable, I have long struggled with its low win rate.
The issue lies in the immaturity of the exit strategy, and I’m currently experimenting to see if I can solve that.
In V2, I added three take‑profit lines, securing 30% of the profit at each level to ensure a minimum level of gain.
Additionally, when the trend weakens, half of the position is closed.
In all scenarios, the remaining position is held until the trend reverses.
The system provides precise entries, adaptive exits, and highly visual guidance that helps traders understand trend structure at a glance.
🧠 Key Features
🔹 1. Dual‑EMA Trend Logic (Symbol + External Index)
Both the chart symbol and an external index (OTHERS.D) are evaluated using fast/slow EMAs to determine correlation‑based trend bias.
🔹 2. Dow Theory Swing Detection (Real‑time)
The script identifies swing highs/lows and updates trend direction when price breaks them. This creates a structural trend model that reacts faster than EMAs alone.
🔹 3. Gradient Trend Zones (Visual Trend Strength)
When trend is up or down, the area between price and the latest swing level is filled with a multi‑step gradient. This makes trend strength and distance-to-structure visually intuitive.
🔹 4. Higher‑Timeframe Swing Trend (htfTrend)
Swing highs/lows from a higher timeframe (e.g., 4H) are plotted to show macro structure. Used only for visual context, not for filtering entries.
🔹 5. RSI‑Based Entry Protection
RSI prevents entries during extreme overbought/oversold conditions.
🔹 6. Dynamic Exit System
Includes:
Custom stop‑loss (%)
Partial take‑profit (TP1/TP2/TP3)
Automatic scale‑out when trend color weakens
“Color‑change lockout” to prevent immediate re‑entry
Real‑time PnL tracking and labels
🔹 7. Alerts for All Key Events
Entry, stop‑loss, partial exits, and trend‑change exits all generate structured JSON alerts.
🔹 8. Visual PnL Labels & Equity Tracking
PnL for the latest trade is displayed directly on the chart, including scale‑out adjustments.
⚙️ Input Parameters
Parameter Description
Fast EMA / Slow EMA EMAs used for symbol trend detection
Index Fast / Slow EMA EMAs applied to external index
StopLoss (%) Custom stop‑loss threshold
Scale‑Out % Portion to exit when trend color weakens
RSI Period / Levels Overbought/oversold filters
Swing Detection Length Bars used to detect swing highs/lows
Stats Display Position of statistics table
🧭 About htfTrend (Higher Timeframe Trend)
The higher‑timeframe swing trend is displayed visually but not used for entry logic.
Why? Strict HTF filtering reduces trade frequency and often removes profitable setups. By keeping it visual‑only, traders retain flexibility while still benefiting from macro structure awareness.
Use it as a contextual guide, not a constraint.
📘 概要
DOGEの現在の最適値です。
2時間足での使用を想定しています。
このスクリプトは複雑な設定が必要ですが、どこかに最適値が存在します。
今回は現在私が個人的に使っている設定値の公開です。
Take ProfitをOFFにするとさらなる利益が望めますが、勝率が下がるなどのリスクが上がります。
ONにした状態で数値を上げることによって調整することが可能です。
私はダウ理論を使ったトレードを長年続けてきました。
ダウ理論とEMAを使ったトレードが私の主力です。
しかし利益は出るものの、長年その勝率の低さに悩んでいました。
問題は出口戦略が未熟なためで、現在はそれらの解決ができないかと試行錯誤を続けています。
V2では3本の利益確定ラインを引き、それぞれ30%ずつ利益を確定し、最低限の利益がでるようにしました。
それ以外にはトレンドが弱まったタイミングで半分の利益確定をし、どのパターンでも残ったポジションはトレンド転換まで持ち続けます。
🧠 主な機能
🔹 1. 銘柄+外部インデックスの EMA クロス判定
対象銘柄と OTHERS.D の EMA を比較し、相関を考慮したトレンド方向を判定します。
🔹 2. ダウ理論に基づくスイング高値・安値の自動検出
スイング更新によりトレンド方向を切り替える、構造ベースのトレンド判定を採用。
🔹 3. グラデーション背景によるトレンド強度の可視化
スイングラインから現在価格までを段階的に塗り分け、 「どれだけトレンドが伸びているか」を直感的に把握できます。
🔹 4. 上位足スイングトレンド(htfTrend)の表示
4H などの上位足でのスイング高値・安値を表示し、 大局的なトレンド構造を視覚的に把握できます(ロジックには未使用)。
🔹 5. RSI による過熱・売られすぎフィルター
極端な RSI 状態でのエントリーを防止。
🔹 6. 動的イグジットシステム
カスタム損切り(%)
TP1/TP2/TP3 の段階的利確
トレンド色の弱まりによる自動スケールアウト
色変化後の再エントリー制限(waitForColorChange)
リアルタイム PnL の追跡とラベル表示
🔹 7. アラート完備(JSON 形式)
エントリー、損切り、部分利確、トレンド反転などすべてに対応。
🔹 8. 損益ラベル・統計表示
直近トレードの損益をチャート上に表示し、視覚的に把握できます。
⚙️ 設定項目
設定項目名 説明
Fast / Slow EMA 銘柄の EMA 設定
Index Fast / Slow EMA 外部インデックスの EMA 設定
損切り(%) カスタム損切りライン
部分利確割合 トレンド弱化時のスケールアウト割合
RSI 期間・水準 過熱/売られすぎフィルター
スイング検出期間 スイング高値・安値の検出に使用
統計表示位置 テーブルの表示位置
🧭 上位足トレンド(htfTrend)について
上位足スイングの更新に基づくトレンド判定を表示しますが、 エントリー条件には使用していません。
理由: 上位足を厳密にロジックへ組み込むと、トレード機会が大幅に減るためです。
本ストラテジーでは、 「大局の把握は視覚で、エントリーは柔軟に」 という設計思想を採用しています。
→ 裁量で利確判断や逆張り回避に活用できます。

Moving Average Structure ZigZag [Stable & Filtered]
(日本語説明)
このインジケーターは、移動平均線(MA)の転換に基づき、相場の「真の構造」を可視化するために開発されました。 通常のZigZagのように価格の単純な反転に依存せず、「MAのトレンド転換 + 指定した値幅の到達」という2つの条件を用いることで、レンジ相場の細かなノイズ(ダマシ)を排除し、ダウ理論に基づいた重要な高値・安値だけを結びます。
💡 主な機能
MAタイプの切り替え: SMA, EMA, HMA, VW-HMAなど、目的に合わせたトレンド感度を選択可能。
値幅フィルター(Min Deviation): 添付画像のように、小さな値動きをカットし、大きな市場構造だけを抽出します。
価格アクションへの追従: ラインはMAの数値ではなく、期間内の実最高値・最安値を正確に結び、高値更新時には自動で延伸されます。
🛠 活用シーン
環境認識: 上位足での大きな波形を確認し、現在のフェーズを定義。
ノイズ除去: 市場の主要な節目(レジサポ候補)の特定。
ダウ理論の視覚化: 高値・安値の切り上がり・切り下がりを明確化。
(English Description)
This indicator was developed to visualize the "True Market Structure" based on Moving Average (MA) reversals. Unlike standard ZigZag which relies solely on price reversals, this tool combines MA Trend Reversals and a Minimum Deviation filter to eliminate market noise and highlight significant swing highs and lows based on Dow Theory.
💡 Key Features
Multiple MA Types: Select from SMA, EMA, HMA, VW-HMA, etc., to match your preferred trend sensitivity.
Min Deviation Filter: As shown in the attached image, it filters out minor price fluctuations to extract only the major market waves.
Price Action Tracking: The lines connect the actual High/Low prices within the period, not the MA values themselves. Lines automatically extend when a trend continues to new highs/lows.
🛠 Use Cases
Market Context: Identify major wave patterns on higher timeframes to define the current phase.
Noise Reduction: Pinpoint key market levels and potential support/resistance.
Dow Theory Visualization: Clearly visualize higher highs/lows and trend shifts.
Settings
MA Type: Choose the type of Moving Average.
Moving Average Length: The lookback period for structure.
Min Deviation (Pips): The threshold to filter noise. Adjust according to the volatility of the pair.

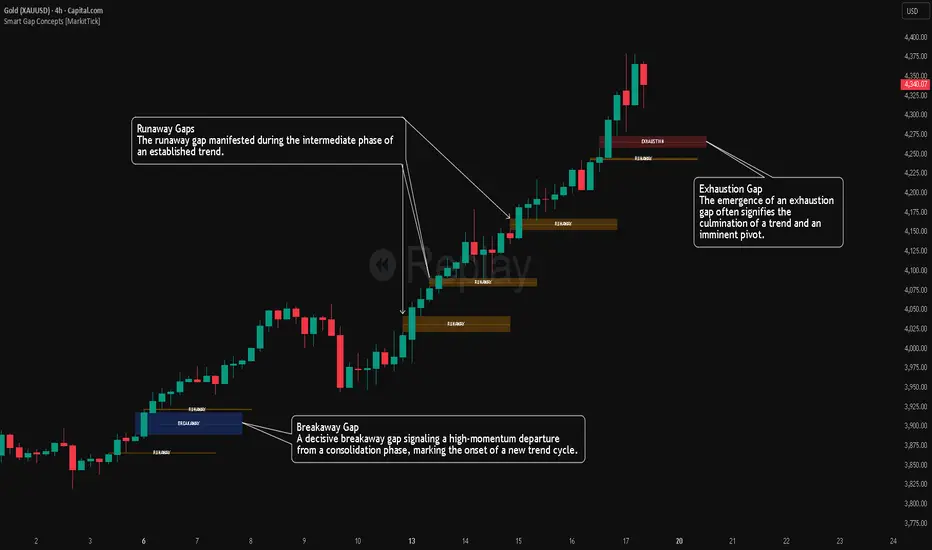
Smart Gap Concepts [MarkitTick]💡 This indicator automates the identification and classification of price gaps, commonly known as Fair Value Gaps (FVG) or Imbalances, by integrating market structure and volume analysis. Unlike standard gap detectors that simply highlight empty space on a chart, this script applies algorithmic filters to categorize gaps into three distinct phases of market movement: Breakaway, Runaway, and Exhaustion. This helps traders understand the potential context of a move rather than just seeing a support or resistance zone.
● Originality and Utility
The primary innovation of this tool is its dynamic classification system. It moves beyond visual detection by checking the "why" behind the gap. By referencing Swing Highs and Swing Lows (Market Structure) alongside Volume efficiency, it determines if a gap represents a breakout, a trend continuation, or a climatic end to a move. Additionally, the script features an automated mitigation tracking system that removes gaps from the chart once price has re-tested the midpoint, ensuring the visual workspace remains clean and relevant to current price action.
● Methodology
The script operates on a multi-stage logic engine:
• Gap Detection
It first identifies the core imbalance where the Low of the current bar does not overlap with the High of the bar two periods prior (for bullish gaps), ensuring the intervening candle represents a strong displacement.
• Structural Analysis (Breakaway Gaps)
The script monitors Pivot Highs and Lows. If a gap occurs simultaneously with a close beyond a key structural Pivot, it is classified as a "Breakaway Gap." This signals the potential start of a new trend.
• Volume and Time Analysis (Exhaustion Gaps)
To identify potential reversals, the script looks for "Trend Maturity." If a gap forms after a long duration since the last pivot and is accompanied by a volume spike (defined by the Volume Spike Multiplier), it is labeled as an "Exhaustion Gap."
• Continuation (Runaway Gaps)
If a gap is valid but meets neither the Breakaway nor Exhaustion criteria, it is considered a "Runaway Gap," typically found in the middle of an established trend.
• Dynamic Cleanup
The script tracks the midpoint of every active gap. If price creates a lower low (for bullish gaps) or higher high (for bearish gaps) beyond this midpoint, the gap is considered mitigated and is removed from the screen.
📖 How to Use
Traders can utilize the color-coded classifications to gauge market intent:
Breakaway (Default Blue): Watch these zones for potential trend initiations. These are often high-probability areas for a retest entry after a structure break.
Runaway (Default Orange): These indicate strong momentum. They can be used to trail stop-losses or add to winning positions, as price should ideally not close below these gaps in a healthy trend.
Exhaustion (Default Red): Be cautious when these appear. They suggest the current move is overextended and a reversal or complex pullback may be imminent.
• Exhaustion Gap : A Practical Case Study
• Breakaway Gap: A Practical Case Study
• Runaway Gap : A Practical Case Study
⚙️ Inputs and Settings
Min Gap Size (Points): Filters out insignificant gaps smaller than this threshold.
Structure Lookback: Defines the sensitivity of the Pivot detection (Swing High/Low).
Volume Avg Length & Multiplier: Determines what qualifies as a "Volume Spike" for exhaustion logic.
Trend Maturity: The minimum number of bars required to consider a trend "old" enough for an exhaustion signal.
Visual Settings: Custom colors for each gap type and box extension length.
● Disclaimer
All provided scripts and indicators are strictly for educational exploration and must not be interpreted as financial advice or a recommendation to execute trades. I expressly disclaim all liability for any financial losses or damages that may result, directly or indirectly, from the reliance on or application of these tools. Market participation carries inherent risk where past performance never guarantees future returns, leaving all investment decisions and due diligence solely at your own discretion.
Price Action High 2 + Risk/Reward VisualizerIntroduction: Price Action High 2 (Bull Flag) Setup
This script identifies the High 2 (H2) setup, a staple price action pattern popularized by Al Brooks. The High 2 is a high-probability continuation pattern designed to catch the resumption of a bull trend after a two-legged pullback (a "complex" bull flag).
In a strong uptrend, the first attempt to end a pullback often fails (High 1). The High 2 represents the second, and usually more reliable, attempt by bulls to take control, often forming a "double bottom" structure within the flag.
How the Logic Works
The indicator follows a strict state-machine logic to ensure the pattern is valid:
Trend Confirmation: The script filters for an established uptrend where price is above a rising EMA (adjustable in settings).
Pullback Identification: It looks for a sequence of bars making lower highs.
High 1 (H1): The first bar in the correction that breaks above the high of the prior bar.
The Second Leg: The script then waits for the price to again fail to break a high, confirming a second leg of the pullback.
High 2 (H2): The signal is triggered when a bar breaks the high of the previous bar for the second time.
Key Features
Signal Bar Quality Filter: Not all High 2s are equal. This script includes a filter ensuring the signal bar closes in the upper portion of its range (bullish conviction) to avoid "weak" breakouts.
Automated Risk/Reward Visualizer: Upon a signal, the script automatically projects a Stop Loss (at the signal bar low) and a Take Profit level based on a customizable R:R ratio.
Clean Visuals: Labeled "H2" markers and dashed trend lines keep the chart uncluttered.
How to Trade It
Entry: Place a buy-stop order 1 tick above the High 2 signal bar.
Stop Loss: Traditionally placed below the low of the signal bar or the most recent swing low.
Target: Common targets include a 1:2 Risk/Reward ratio or the previous major swing high.
Settings Guide
EMA Length: Adjust this to match your timeframe (e.g., 20 for intraday, 50 for daily).
Min Close %: Set this to 50% or higher to ensure you only take trades where the bulls finished the bar strong.
Risk:Reward Ratio: Customize your profit targets to align with your personal trading plan.

Gann Octave 8 Ver.2.0Gann Octave 8 Ver.2.0 - Complete Trading Guide
Overview
This indicator combines W.D. Gann's time-tested principles of market geometry with modern technical analysis. It identifies key market structures and projects precise support/resistance levels along with angular momentum lines to help traders identify high-probability trading opportunities.
________________________________________
Core Concepts
1. Gann's Octave Division (The Rule of 8)
W.D. Gann discovered that markets move in harmonic divisions based on the number 8. This indicator divides any swing movement into 8 equal parts (octaves):
• 0% - Swing extreme (High for bearish, Low for bullish)
• 12.5% - First octave
• 25% - Quarter level
• 37.5% - Three-eighths level
• 50% - Midpoint (most critical level)
• 62.5% - Five-eighths level
• 75% - Three-quarter level
• 87.5% - Seventh octave
• 100% - Swing extreme (opposite end)
Why 8? Gann believed natural market cycles follow mathematical harmonics. The octave division provides precise entry and exit points that frequently act as support/resistance zones.
2. Gann Angles (Price-Time Relationship)
Gann angles represent the relationship between price movement and time. Each angle shows different momentum levels:
• 1x1 (Black) - 45° angle, perfect balance between price and time. Most important Gann angle. Represents the natural trend line.
• 2x1 (Red) - Steeper angle, 2 units of price per 1 unit of time. Shows strong momentum.
• 1x2 (Red) - Flatter angle, 1 unit of price per 2 units of time. Shows weak momentum.
• 4x1 & 1x4 (Blue) - Even more extreme angles indicating very strong or very weak trends.
• 8x1 & 1x8 (Orange) - Most extreme angles, parabolic moves or complete consolidation.
Key Principle: When price is above the 1x1 angle = bullish. Below 1x1 = bearish. When price crosses from one angle to another, it signals a change in momentum.
________________________________________
How the Indicator Works
Structure Detection
The indicator automatically identifies market swings using pivot points:
1. Bullish Structure (Green): Detected when price makes a higher high
o Octave levels calculated from swing low (0%) to swing high (100%)
o Gann angles project upward from the swing low
2. Bearish Structure (Red): Detected when price makes a lower low
o Octave levels calculated from swing high (0%) to swing low (100%)
o Gann angles project downward from the swing high
Dynamic Updates
• Swing Tracker ON: Levels update continuously as the swing evolves
• Swing Tracker OFF: Levels lock at the initial swing detection (cleaner charts)
Historical Structures
The indicator maintains previous swing structures based on "Number of Swings to Show":
• Set to 1: Only current structure (cleanest)
• Set to 2-3: Current + recent history (recommended for context)
• Set to 4+: Multiple historical structures (may overlap but shows pattern)
________________________________________
Trading Strategy
Entry Signals
BUY SIGNALS (Green Triangle Up ▲)
Signal 1: Bounce from Support Levels
• Price drops to 0%, 50%, or 100% level and reverses
• Best when combined with bullish candlestick pattern (hammer, engulfing)
• Entry: On signal confirmation
• Stop Loss: Below the support level (0.5-1% below)
• Target: Next octave level up (12.5%, 25%, 50%)
Signal 2: Breakout Above Resistance
• Price breaks above 50% or 100% level with momentum
• Confirms trend continuation or reversal
• Entry: On close above the level
• Stop Loss: Below the breakout level
• Target: Previous swing high or next major level
Signal 3: Gann Angle Support
• Price bounces off 1x1 angle (black line)
• Indicates trend is intact
• Entry: When price respects the angle
• Stop Loss: Below the 1x1 angle
• Target: Next resistance level
SELL SIGNALS (Red Triangle Down ▼)
Signal 1: Rejection from Resistance Levels
• Price rallies to 0%, 50%, or 100% level and reverses
• Best when combined with bearish candlestick pattern (shooting star, bearish engulfing)
• Entry: On signal confirmation
• Stop Loss: Above the resistance level (0.5-1% above)
• Target: Next octave level down (87.5%, 75%, 50%)
Signal 2: Breakdown Below Support
• Price breaks below 50% or 0% level with momentum
• Confirms trend continuation or reversal
• Entry: On close below the level
• Stop Loss: Above the breakdown level
• Target: Previous swing low or next major level
Signal 3: Gann Angle Resistance
• Price fails at 1x1 angle (black line)
• Indicates trend weakness
• Entry: When price rejects the angle
• Stop Loss: Above the 1x1 angle
• Target: Next support level
________________________________________
Advanced Trading Techniques
1. The 50% Rule (Most Powerful)
The 50% octave level is the most critical in Gann theory:
• In Uptrend: Price should not break below 50% retracement. If it holds = trend intact, go long.
• In Downtrend: Price should not break above 50% retracement. If it holds = trend intact, go short.
• Reversal: Breaking and closing beyond 50% often signals trend reversal.
2. Gann Angle Confluence
When multiple Gann angles converge with octave levels = HIGH probability zone:
• Look for price to bounce or reverse at these zones
• Example: 1x2 angle meets 50% level = strong support/resistance
• These zones often become pivot points
3. Multiple Timeframe Analysis
• Use higher timeframe (daily) for major structure
• Use lower timeframe (5min, 15min) for precise entries
• Take trades when both timeframes align
4. Swing Failure Pattern
• Price breaks a key level (e.g., 50%) but quickly reverses back
• This "false breakout" often leads to strong move in opposite direction
• Wait for signal in the reversal direction
________________________________________
Settings Optimization
For Day Trading (Scalping)
• Structure Period: 0-2 (22 bars or less)
• Number of Swings: 1 (only current structure)
• Signal Sensitivity: High
• Swing Tracker: OFF (cleaner)
For Swing Trading
• Structure Period: 4-5 (44-88 bars)
• Number of Swings: 2-3
• Signal Sensitivity: Medium
• Swing Tracker: ON or OFF (preference)
For Position Trading
• Structure Period: 6-8 (176+ bars)
• Number of Swings: 3-5
• Signal Sensitivity: Low
• Swing Tracker: ON
________________________________________
Common Patterns to Watch
Bullish Reversal Setup
1. Price in bearish structure (red levels)
2. Price drops to 100% level (swing low)
3. Buy signal appears (green triangle)
4. Price breaks back above 50% level
5. Action: Go long with stop below 100%
Bearish Reversal Setup
1. Price in bullish structure (green levels)
2. Price rises to 100% level (swing high)
3. Sell signal appears (red triangle)
4. Price breaks back below 50% level
5. Action: Go short with stop above 100%
Trend Continuation
1. Price respects 1x1 Gann angle
2. Small pullback to 25% or 37.5% level
3. Buy/sell signal appears
4. Action: Enter in trend direction
________________________________________
________________________________________
Signal Sensitivity Guide
• Low: Conservative, only major breakouts (3-5 signals per day)
• Medium: Balanced, includes approaches (5-10 signals per day)
• High: Aggressive, includes bounces (10-20 signals per day)
Choose based on your trading style and risk tolerance
________________________________________
Final Words
This indicator is a powerful tool, but remember:
"The market is never wrong. Opinions are." - W.D. Gann
• No indicator is 100% accurate
• Always combine with price action and volume
• Backtest on your instrument and timeframe
• Keep learning and adapting your strategy
• Discipline and risk management are more important than the perfect setup
Happy Trading! 📈

EMA and Dow Theory Strategies V2📘 Overview
This strategy is an advanced evolution of the original EMA × Dow Theory hybrid model. V2 introduces true swing‑based trend detection, gradient trend‑zones, higher‑timeframe swing overlays, and dynamic exit logic designed for intraday to short‑term trading across crypto, forex, stocks, and indices.
The system provides precise entries, adaptive exits, and highly visual guidance that helps traders understand trend structure at a glance.
🧠 Key Features
🔹 1. Dual‑EMA Trend Logic (Symbol + External Index)
Both the chart symbol and an external index (OTHERS.D) are evaluated using fast/slow EMAs to determine correlation‑based trend bias.
🔹 2. Dow Theory Swing Detection (Real‑time)
The script identifies swing highs/lows and updates trend direction when price breaks them. This creates a structural trend model that reacts faster than EMAs alone.
🔹 3. Gradient Trend Zones (Visual Trend Strength)
When trend is up or down, the area between price and the latest swing level is filled with a multi‑step gradient. This makes trend strength and distance-to-structure visually intuitive.
🔹 4. Higher‑Timeframe Swing Trend (htfTrend)
Swing highs/lows from a higher timeframe (e.g., 4H) are plotted to show macro structure. Used only for visual context, not for filtering entries.
🔹 5. RSI‑Based Entry Protection
RSI prevents entries during extreme overbought/oversold conditions.
🔹 6. Dynamic Exit System
Includes:
Custom stop‑loss (%)
Partial take‑profit (TP1/TP2/TP3)
Automatic scale‑out when trend color weakens
“Color‑change lockout” to prevent immediate re‑entry
Real‑time PnL tracking and labels
🔹 7. Alerts for All Key Events
Entry, stop‑loss, partial exits, and trend‑change exits all generate structured JSON alerts.
🔹 8. Visual PnL Labels & Equity Tracking
PnL for the latest trade is displayed directly on the chart, including scale‑out adjustments.
⚙️ Input Parameters
Parameter Description
Fast EMA / Slow EMA EMAs used for symbol trend detection
Index Fast / Slow EMA EMAs applied to external index
StopLoss (%) Custom stop‑loss threshold
Scale‑Out % Portion to exit when trend color weakens
RSI Period / Levels Overbought/oversold filters
Swing Detection Length Bars used to detect swing highs/lows
Stats Display Position of statistics table
🧭 About htfTrend (Higher Timeframe Trend)
The higher‑timeframe swing trend is displayed visually but not used for entry logic.
Why? Strict HTF filtering reduces trade frequency and often removes profitable setups. By keeping it visual‑only, traders retain flexibility while still benefiting from macro structure awareness.
Use it as a contextual guide, not a constraint.
📘 概要
本ストラテジーは、V1 を大幅に拡張した EMA × ダウ理論 × スイング構造 × 上位足トレンド可視化 の複合型モデルです。 短期〜デイトレード向けに最適化されており、仮想通貨・FX・株式・指数など幅広いアセットで利用できます。
V2 では、スイング構造の自動検出、グラデーションによるトレンド強度の可視化、上位足スイングライン、動的な利確/損切りロジック が追加され、視覚的にもロジック的にも大幅に強化されています。
🧠 主な機能
🔹 1. 銘柄+外部インデックスの EMA クロス判定
対象銘柄と OTHERS.D の EMA を比較し、相関を考慮したトレンド方向を判定します。
🔹 2. ダウ理論に基づくスイング高値・安値の自動検出
スイング更新によりトレンド方向を切り替える、構造ベースのトレンド判定を採用。
🔹 3. グラデーション背景によるトレンド強度の可視化
スイングラインから現在価格までを段階的に塗り分け、 「どれだけトレンドが伸びているか」を直感的に把握できます。
🔹 4. 上位足スイングトレンド(htfTrend)の表示
4H などの上位足でのスイング高値・安値を表示し、 大局的なトレンド構造を視覚的に把握できます(ロジックには未使用)。
🔹 5. RSI による過熱・売られすぎフィルター
極端な RSI 状態でのエントリーを防止。
🔹 6. 動的イグジットシステム
カスタム損切り(%)
TP1/TP2/TP3 の段階的利確
トレンド色の弱まりによる自動スケールアウト
色変化後の再エントリー制限(waitForColorChange)
リアルタイム PnL の追跡とラベル表示
🔹 7. アラート完備(JSON 形式)
エントリー、損切り、部分利確、トレンド反転などすべてに対応。
🔹 8. 損益ラベル・統計表示
直近トレードの損益をチャート上に表示し、視覚的に把握できます。
⚙️ 設定項目
設定項目名 説明
Fast / Slow EMA 銘柄の EMA 設定
Index Fast / Slow EMA 外部インデックスの EMA 設定
損切り(%) カスタム損切りライン
部分利確割合 トレンド弱化時のスケールアウト割合
RSI 期間・水準 過熱/売られすぎフィルター
スイング検出期間 スイング高値・安値の検出に使用
統計表示位置 テーブルの表示位置
🧭 上位足トレンド(htfTrend)について
上位足スイングの更新に基づくトレンド判定を表示しますが、 エントリー条件には使用していません。
理由: 上位足を厳密にロジックへ組み込むと、トレード機会が大幅に減るためです。
本ストラテジーでは、 「大局の把握は視覚で、エントリーは柔軟に」 という設計思想を採用しています。
→ 裁量で利確判断や逆張り回避に活用できます。

SMT Divergence [Kodexius]SMT Divergence is a correlation-based divergence detector built around the Smart Money Technique concept: when two normally correlated instruments should be making similar swing progress, but one prints a new extreme while the other fails to confirm it. This “disagreement” can be a valuable contextual signal around liquidity runs, distribution phases, and potential reversal or continuation points.
The script compares the chart symbol (primary) with a user-selected comparison symbol (for example BTC vs ETH, ES vs NQ, EUR/USD vs GBP/USD) and automatically scans both instruments for confirmed swing highs and swing lows using pivot logic. Once swings are established, it checks for classic SMT conditions:
Primary makes a new swing extreme while the comparison symbol forms a non-confirming swing .
To support a wider range of markets, the indicator includes an Inverse Correlation option for pairs that typically move opposite to each other (for example DXY vs EUR/USD). With this enabled, the divergence rules are logically flipped so that the script still detects “non-confirmation” in a way that is consistent with the pair’s relationship.
The indicator is designed to be readable and actionable. It can draw divergence labels directly on the main chart, connect the relevant swing points with lines, show a compact information table with the last signal and settings, and optionally render the comparison symbol as a mini candle chart in the indicator pane for quick visual validation.
🔹 Features
🔸 Two-Symbol SMT Analysis (Primary vs Compare)
Select any comparison symbol to evaluate correlation structure and divergence. The script fetches the comparison OHLC data using the current chart timeframe to keep both series aligned for analysis.
🔸 Inverse Correlation Mode
For inversely correlated pairs, enable “Inverse Correlation” so the script interprets confirmation appropriately (for example, a higher low on the comparison instrument might be expected to correspond to a lower low on the primary, depending on the relationship). This helps avoid false conclusions when the pair naturally moves opposite.
🔸 Pivot-Based Swing with Adjustable Sensitivity
Swings are detected using confirmed pivots (left bars and right bars). This provides cleaner structural swing points compared with raw candle-to-candle comparisons, and it lets you control sensitivity for different market conditions and timeframes. The script also limits stored swing history to keep performance stable.
🔸 Flexible Detection Mode: Time Matched or Independent Swings
You can choose how swings are paired across instruments:
Time Matched searches for a comparison swing that occurred at the same pivot time as the primary swing.
Independent Swings compares each symbol’s own last two swings without requiring an exact time match.
🔸 Range Control and Noise Filtering
To reduce weak or irrelevant signals:
“Max Bars Between Swings” ensures the two swings being compared are close enough in structure to be meaningful.
“Min Price Diff (%)” can require a minimum percentage change between the primary’s last two swing prices to confirm the move is significant.
🔸 Clear Visual Output with Tooltips
When a divergence is detected, the script can print a label (“SMT”) with bullish or bearish styling and a tooltip that includes the symbol pair and the primary swing price for quick context.
🔸 Divergence Lines for Context
Optional lines connect the relevant swing points, making it easier to see the exact structure that triggered the signal. One line can be drawn on the main chart and another in the indicator pane for the comparison series.
🔸 Info Table (At a Glance)
A compact table can display the active symbols, correlation mode, total divergences stored, and the most recent signal type.
🔸 Alerts Included
Built-in alert conditions are provided for bullish SMT, bearish SMT, and any SMT event so you can automate notifications without editing the code.
🔸 Optional Comparison Candle Panel
If enabled, the indicator can plot the comparison symbol as candles in the indicator pane. This is useful for confirming whether the divergence is happening around major levels, consolidations, or impulsive legs on the secondary instrument.
🔹 Calculations
This section summarizes the core logic used by the script.
1. Data Synchronization (Comparison Symbol)
The comparison instrument is requested on the chart’s current timeframe so swing calculations are performed consistently:
=
request.security(compareSymbolInput, timeframe.period, )
This ensures pivots and swing times are derived from the same bar cadence as the primary chart.
2. Swing Detection via Confirmed Pivots
Swings are detected using pivot logic with user-defined left and right bars:
primaryPivotHigh = ta.pivothigh(high, pivotLeftBars, pivotRightBars)
primaryPivotLow = ta.pivotlow(low, pivotLeftBars, pivotRightBars)
Because pivots are confirmed only after the “right bars” have closed, the script stores each swing using an offset so the swing’s bar index and time reflect where the pivot actually occurred, not where it was confirmed.
3. Swing Storage and Retrieval
Both symbols maintain arrays of SwingPoint objects. Each new swing is pushed into the array, and older swings are dropped once the array exceeds the configured maximum. This makes the divergence engine predictable and prevents uncontrolled memory growth.
The script then retrieves the last and previous swing highs and lows (per symbol) to evaluate structure.
4. Matching Logic (Time Matched vs Independent)
When “Time Matched” is selected, the script searches the comparison swing array for a pivot that occurred at the exact same timestamp as the primary swing. When “Independent Swings” is selected, it simply uses the comparison symbol’s last two swings of the same type.
5. Bullish SMT Condition (LL vs HL)
A bullish SMT event is defined as:
Primary forms a lower low (last low < previous low)
Comparison forms a higher low (last low > previous low)
If inverse correlation is enabled, the comparison condition flips to maintain logical confirmation rules
The two primary swings must be within the configured bar distance window
Optional minimum percentage difference must be satisfied
A simple anti duplication rule prevents repeated triggers on the same structure
These checks are implemented directly in the bullish detection block.
6. Bearish SMT Condition (HH vs LH)
A bearish SMT event is defined as:
Primary forms a higher high (last high > previous high)
Comparison forms a lower high (last high < previous high)
Inverse correlation flips the comparison rule
Range checks, minimum difference filtering, and duplicate protection apply similarly
These checks are implemented in the bearish detection block.
7. Percentage Difference Filter
The optional “Min Price Diff (%)” filter measures the relative distance between the last two primary swing prices. This prevents very small structural changes from being treated as valid SMT signals.
priceDiffPerc = math.abs(lastSwing.price - prevSwing.price) / prevSwing.price * 100.0
The divergence condition is only allowed to trigger if this value exceeds the user defined threshold.
priceOk = priceDiffPerc >= minPriceDiff
This filter is especially useful on higher timeframes or during low volatility conditions, where micro structure noise can otherwise produce misleading signals.
8. Visualization and Output
When a divergence is confirmed, the script:
Stores the event in a divergence array (limited by “Max Divergences to Display”)
Draws a directional SMT label with a tooltip (optional)
Draws connecting lines using time based coordinates for clean alignment (optional)
It also updates an information table on the last bar only, and exposes alertconditions for automation workflows.

Structure Lite - Automatic Major Trend LinesStructure Lite – Pivot-Based Market Structure Visualization
OVERVIEW
Structure Lite is an open-source charting tool designed to assist traders in visualizing higher-timeframe market structure. The script identifies major swing points using high-period pivot analysis and projects structural support and resistance lines directly on the chart. Its purpose is to highlight persistent market structure while minimizing visual noise.
CORE CONCEPTS & CALCULATIONS
Pivot Identification
The script uses Pine Script’s built-in ta.pivothigh() and ta.pivotlow() functions to identify confirmed swing highs and lows. A pivot is only validated after a user-defined number of bars (Major Pivot Lookback) have formed on both sides of the price extreme, ensuring that only structurally significant pivots are selected.
Structural Pairing
Each structural line is created only after two consecutive pivots of the same type are confirmed (high-to-high or low-to-low). The script stores the price and bar index of these pivots and uses them as fixed anchor points.
Line Projection
Once a valid pivot pair is formed, the script draws a line between the two points using line.new() and extends it forward using extend.right. These lines represent projected structural boundaries rather than trade signals.
Object Management
To maintain chart clarity and performance, the script manages all drawn objects through a line array. A FIFO (First-In, First-Out) method is applied so that only the three most recent structural lines remain visible. Older lines are automatically deleted as new ones are created.
DESIGN PHILOSOPHY & ORIGINALITY
While many indicators plot frequent swing points or short-term pivots, Structure Lite focuses on structural persistence. By filtering for higher-period pivots and limiting the number of displayed projections, the script emphasizes dominant market structure rather than short-term fluctuations. This approach is intended to support discretionary analysis, not replace it.
HOW TO USE
Major Pivot Lookback
Increase the value to focus on higher-timeframe structure (e.g., swing or position trading).
Decrease the value to visualize intraday structural levels.
Visual Encoding
Green lines represent projected structural support
Red lines represent projected structural resistance
Visibility Control
A boolean input allows all structure lines to be hidden instantly to restore a clean price chart.
LIMITATIONS & DISCLAIMER
This script is a visualization tool only. It does not generate trade signals, entry or exit points, alerts, or directional forecasts. All plotted levels are derived from historical price action and may change as new pivots form. The script is provided for educational and analytical purposes and should be used in conjunction with other forms of market analysis

Smart Money Swing Strategy [All-in-One]# Pro Swing Trader 📈
A comprehensive swing trading indicator for TradingView that combines multiple confluence factors to identify high-probability trade setups with built-in risk management.
## 🎯 Overview
This indicator is designed for swing traders who want to catch momentum pullbacks with precision entries. It filters trades using multiple timeframe analysis, RSI zones, volume confirmation, and EMA trends to deliver only the highest-confidence setups.
### Key Features
✅ **Multi-Timeframe Confluence** - Confirms trades with higher timeframe analysis (Daily, 4H, etc.)
✅ **Smart Entry Signals** - Detects pullback-to-EMA reclaim patterns
✅ **Automatic Risk Management** - Calculates stops, targets, and R-multiples
✅ **Dynamic Stop Loss** - ATR trailing stop + break-even automation
✅ **Real-Time HUD Dashboard** - Live confluence scoring and trade metrics
✅ **Comprehensive Alerts** - Entry, TP1, TP2, and stop-loss notifications
✅ **Visual Trade Levels** - Clear on-chart stop-loss and take-profit lines
---
## 📊 How It Works
### Signal Logic
The indicator identifies two types of signals:
**Base Signals** (Small triangles):
- Price pulls back between Fast EMA and Slow EMA
- RSI is in the swing zone (40-60 by default)
- Price reclaims the Fast EMA with momentum
- Optional: Volume spike confirmation
**High-Confidence Signals** (Large triangles):
- All base signal criteria met
- Higher timeframe confirms the trend direction
- HTF RSI and slope alignment
- These are your primary trade signals
### Entry Conditions
#### Long Entry (🟢 HC L)
1. Fast EMA > Slow EMA (uptrend)
2. Previous candle closed between the EMAs (pullback)
3. Current candle crosses above and closes above Fast EMA (reclaim)
4. RSI between 40-60 (swing zone)
5. **HTF Confirmation**: Daily/4H price above EMA50, RSI > 50, positive slope
6. Optional: Volume > 1.5x 20-bar average
#### Short Entry (🔻 HC S)
1. Fast EMA < Slow EMA (downtrend)
2. Previous candle closed between the EMAs (pullback)
3. Current candle crosses below and closes below Fast EMA (reclaim)
4. RSI between 40-60 (swing zone)
5. **HTF Confirmation**: Daily/4H price below EMA50, RSI < 50, negative slope
6. Optional: Volume > 1.5x 20-bar average
---
## 🎛️ Settings & Parameters
### Trend Parameters
- **Fast EMA**: Default 20 - Quick trend detection
- **Slow EMA**: Default 50 - Major trend filter
- **Swing Lookback**: Default 10 - Bars to find swing high/low for stops
### RSI Settings
- **RSI Length**: Default 14
- **RSI Min**: Default 40 - Lower bound of swing zone
- **RSI Max**: Default 60 - Upper bound of swing zone
### Risk Management
- **Final TP Risk-Reward (R)**: Default 2.0 - Main profit target multiplier
- **TP1 R Multiple**: Default 1.0 - Partial profit target
- **Use Break-even Stop**: Move stop to entry after 1R profit
- **ATR Trailing Stop**: Dynamic stop based on ATR(14) x 2.0
### Filters
- **Require Volume Spike**: Optional volume confirmation filter
- **Use Higher TF Confirmation**: Enable multi-timeframe analysis
- **Higher TF**: Default "D" (Daily) - Can use 240 (4H), W (Weekly), etc.
---
## 📈 Dashboard (HUD)
The top-center dashboard shows real-time confluence status:
| Column | Meaning |
|--------|---------|
| **Trend** | Current trend direction (UP/DOWN/Flat) |
| **HTF** | Higher timeframe alignment (Bull/Bear/Flat) |
| **RSI Zone** | Is RSI in swing zone? (YES/NO) |
| **Volume** | Volume spike detected? (YES/NO) |
| **Signal** | Active signal type (HC LONG/HC SHORT/None) |
| **R Risk** | Current profit in R-multiples |
| **Stop** | Current stop-loss level |
| **TP1** | Partial take-profit status |
| **TP2** | Final take-profit status |
| **Conf %** | Overall confluence score (0-100%) |
### Confidence Score Breakdown
- **20%** - Trend present (up or down)
- **30%** - HTF confirmation aligned (or 15% if HTF off)
- **20%** - RSI in swing zone
- **10%** - Volume spike
- **20%** - High-confidence signal triggered
**Scoring**:
- 🟢 70%+ = High probability setup
- 🟡 40-69% = Moderate setup
- 🔴 <40% = Low probability
---
## 🔔 Alert Setup
The indicator includes 8 alert conditions:
### Entry Alerts
- **HC LONG ENTRY** - High-confidence long signal triggered
- **HC SHORT ENTRY** - High-confidence short signal triggered
### Profit Target Alerts
- **LONG TP1 Reached** - Hit partial profit (1R by default)
- **LONG Final TP Reached** - Hit final target (2R by default)
- **SHORT TP1 Reached** - Hit partial profit
- **SHORT Final TP Reached** - Hit final target
### Stop Loss Alerts
- **LONG Stop/BE/Trail Level Hit** - Long position stopped out
- **SHORT Stop/BE/Trail Level Hit** - Short position stopped out
### How to Set Up Alerts
1. Click "Add Alert" on TradingView
2. Choose this indicator from the dropdown
3. Select desired alert condition
4. Set alert to trigger "Once Per Bar Close"
5. Customize notification method (popup/email/webhook)
---
## 📋 Trading Workflow
### 1. Wait for High-Confidence Signal
Look for the large **HC L** or **HC S** triangle on chart close.
### 2. Verify Confluence
Check the HUD dashboard:
- Confidence score should be 70%+
- HTF status should show alignment
- RSI Zone should be "YES"
### 3. Entry
Enter the trade at market or on next candle open.
### 4. Set Stop Loss
Use the **initial stop** shown in the HUD (red line on chart):
- **Longs**: Below the swing low (10-bar lookback)
- **Shorts**: Above the swing high (10-bar lookback)
### 5. Set Take Profits
- **TP1**: 1R (50% position close) - Yellow line
- **TP2**: 2R (remaining 50% close) - Green line
### 6. Manage the Trade
- Monitor the **R Risk** column to track profit
- Stop moves to break-even automatically after 1R (if enabled)
- ATR trailing stop engages dynamically (red line adjusts)
- Exit if price hits dynamic stop level
---
## 🎨 Visual Guide
### On-Chart Elements
**Triangles**:
- Small lime/red triangles = Base signals (lower confidence)
- Large lime/red triangles = High-confidence signals (trade these!)
**Lines**:
- 🟢 Green line = Fast EMA (20)
- 🟠 Orange line = Slow EMA (50)
- 🔴 Red line = Dynamic stop-loss level
- 🟡 Yellow line = TP1 level
- 🟢 Green line = TP2 (final target)
**HUD Colors**:
- 🟢 Green = Bullish/Active/Good
- 🔴 Red = Bearish/Inactive/Warning
- 🟡 Yellow = Neutral/Caution
- 🔵 Blue = Informational
- ⚫ Gray = Disabled/Off
---
## 💡 Strategy Tips
### Best Practices
1. **Only trade High-Confidence signals** - Ignore base signals unless very experienced
2. **Respect the HTF** - Don't fight the higher timeframe trend
3. **Use proper position sizing** - Risk 1-2% of account per trade
4. **Partial profits work** - Take 50% off at TP1, let rest run to TP2
5. **Let winners run** - Trailing stop helps capture extended moves
6. **Be patient** - Quality over quantity; wait for 70%+ confluence
### Optimal Timeframes
- **Primary Chart**: 1H, 4H, Daily (swing trading)
- **HTF Setting**: One level higher than your chart
- If trading 1H → Set HTF to 4H or D
- If trading 4H → Set HTF to D or W
- If trading Daily → Set HTF to W
### Market Conditions
**Best Performance**:
- Trending markets with healthy pullbacks
- Clear support/resistance zones
- Moderate volatility
**Avoid Trading**:
- Extremely choppy/sideways markets
- Major news events (unless experienced)
- Low confidence scores (<40%)
---
## ⚙️ Advanced Customization
### Aggressive Setup (More Signals)
```
Fast EMA: 12
Slow EMA: 26
RSI Min: 35
RSI Max: 65
Use HTF Confirmation: OFF
Require Volume Spike: OFF
```
### Conservative Setup (Fewer, Higher Quality)
```
Fast EMA: 20
Slow EMA: 50
RSI Min: 45
RSI Max: 55
Use HTF Confirmation: ON
Require Volume Spike: ON
Final TP R: 3.0
```
### Scalping Adaptation (Not Recommended)
```
Fast EMA: 9
Slow EMA: 21
Swing Lookback: 5
TP1 R: 0.5
Final TP R: 1.0
```
---
## ⚠️ Risk Disclaimer
**IMPORTANT**: This indicator is for educational and informational purposes only.
- Past performance does not guarantee future results
- No indicator is 100% accurate
- Always use proper risk management
- Never risk more than you can afford to lose
- Consider using a demo account first
- Seek professional financial advice if needed
Trading involves substantial risk of loss and is not suitable for all investors.
---
## 🔧 Troubleshooting
### "No signals appearing"
- Check if HTF confirmation is enabled but market isn't aligned
- Verify RSI zone isn't too restrictive
- Ensure volume spike isn't filtering out all setups
- Try adjusting EMA lengths for your asset
### "Too many false signals"
- Enable HTF confirmation
- Tighten RSI zone (e.g., 45-55)
- Enable volume spike requirement
- Only trade 70%+ confidence setups
### "Stops too tight/wide"
- Adjust Swing Lookback length
- Modify ATR multiplier for trailing stop
- Consider the asset's volatility
### "Alerts not working"
- Ensure alert is set to "Once Per Bar Close"
- Check indicator is added to the chart
- Verify TradingView notification settings
---
## 📚 Version History
**v1.0 (Current)**
- Initial release
- Multi-timeframe confluence system
- Dynamic risk management
- Real-time HUD dashboard
- Comprehensive alert system
- ATR trailing stops
- Break-even automation
---
## 🤝 Support & Feedback
If you find this indicator helpful:
- ⭐ Star the script on TradingView
- 💬 Share your results and feedback
- 🐛 Report bugs or suggest improvements
- 📖 Share with other traders
---
## 📖 Additional Resources
### Recommended Reading
- "The New Trading for a Living" by Dr. Alexander Elder
- "Swing Trading Using Multiple Timeframes" - Educational articles
- Risk management and position sizing guides
### Learn More About
- Multiple timeframe analysis
- EMA crossover strategies
- RSI divergence and zones
- ATR-based stops
- R-multiple profit management
---
## 📝 License
This indicator is provided as-is for personal trading use.
**Usage Rights**:
- ✅ Use for personal trading
- ✅ Modify for personal use
- ❌ Resell or redistribute
- ❌ Claim as original work
---
## 🎓 Quick Start Checklist
- Add indicator to TradingView chart
- Set your preferred timeframe (1H/4H/Daily)
- Configure HTF setting (one level higher)
- Review default parameters
- Set up entry alerts (HC LONG/SHORT)
- Set up TP and SL alerts
- Test on historical data
- Paper trade first
- Start with small position sizes
- Track your results
---
**Happy Trading! 📊💰**
*Remember: Discipline, patience, and risk management are the keys to long-term success.*

Liquidity Sweep Reentry ToolkitHere’s a clear breakdown of what your Liquidity Sweep Reentry Toolkit script does, and how you can use it on your charts:
🔎 Script Breakdown
1. Visual Controls (Inputs)
• : Master toggle to turn all visuals on/off.
• : Show labels when a liquidity sweep + ChoCh condition occurs.
• : Plot green/red triangles for bullish/bearish reentry signals.
• : Prevent multiple signals within the same swing.
• : Show HH/HL/LL/LH market structure letters.
• : Slider to adjust how dim the background of HH/HL/LL/LH labels appear.
2. Core Conditions
• Defines simple bullish () and bearish () candles.
• is a placeholder for your Change of Character logic.
3. Sweep Detection
• : Detects when price makes a new high compared to the last 5 bars.
• : Detects when price makes a new low compared to the last 5 bars.
4. Restriction Flags
• Tracks whether a sweep signal has already triggered in the current swing.
• Resets when sweeps end, so new signals can appear.
5. Composite Triggers
• : Fires when bullish candle + buy-side sweep + ChoCh condition align.
• : Fires when bearish candle + sell-side sweep + ChoCh condition align.
6. Visual Labels
• Gold labels mark “BS Sweep + ChoCh” or “SS Sweep + ChoCh” events.
• Green triangle below bar = bullish reentry.
• Red triangle above bar = bearish reentry.
• Blue HH/HL/LL/LH labels narrate market structure pivots, with adjustable transparency.
7. Alerts
• Alerts can be set for bullish or bearish sweep reentry triggers, so you get notified when conditions align.
📘 How to Use It
1. Apply to Chart
Add the script to your TradingView chart (works best on intraday timeframes like 5‑minute).
2. Configure Visuals
• Use the Visual Controls panel to toggle features on/off.
• Adjust the Label Transparency slider to dim or brighten the HH/HL/LL/LH labels.
3. Interpret Signals
• Gold labels show when a sweep + ChoCh condition occurs.
• Triangles mark potential reentry points (green = bullish, red = bearish).
• HH/HL/LL/LH labels narrate market structure shifts for clarity.
4. Set Alerts
• Use the built‑in alert conditions to get notified when bullish or bearish sweep reentry triggers fire.
👉 In short: this toolkit helps you spot liquidity sweeps, confirm with ChoCh, and visualize reentry signals, while also narrating market structure pivots. It’s modular, so you can toggle features depending on how much visual clutter you want.
🛠 Workflow Example
1. Setup
• Apply the script to your chart (e.g., 5‑minute S&P futures).
• In the indicator settings, decide which visuals you want:
• Turn on Sweep + ChoCh labels if you want to see gold tags narrating liquidity events.
• Keep Entry triangles on to highlight actionable reentry points.
• Adjust the Label Transparency slider so HH/HL/LL/LH structure labels are dim enough not to clutter.
2. Watch for Sweeps
• As price pushes above recent highs → a Buy‑side Sweep is detected.
• As price dips below recent lows → a Sell‑side Sweep is detected.
• If ChoCh logic is true at the same time, you’ll see a gold label (“BS Sweep + ChoCh” or “SS Sweep + ChoCh”).
3. Confirm Reentry
• If conditions align (bullish candle + buy‑side sweep + ChoCh), you’ll see a green triangle below the bar.
• If bearish candle + sell‑side sweep + ChoCh, you’ll see a red triangle above the bar.
• These triangles are your potential reentry triggers.
4. Narrate Market Structure
• HH/HL/LL/LH labels appear at pivots, giving you a running commentary of structure shifts.
• Example: HH → HL → HH shows bullish continuation; LH → LL → LH shows bearish pressure.
• Use the transparency slider to keep these labels subtle but visible.
5. Alerts
• Set alerts for “Bullish Sweep Reentry” or “Bearish Sweep Reentry” so you don’t miss signals even if you’re away from the screen.
📘 How to Use in Practice
• Intraday trading: On a 5‑minute chart, use the toolkit to spot liquidity grabs and confirm reentry points.
• Narration: The HH/HL/LL/LH labels help you keep track of structure without manually marking pivots.
• Decision making: Gold labels + triangles = potential trade setups. Structure labels = context for trend bias.
• Customization: Dim labels when you want a cleaner chart, brighten them when you’re focused on structure.
👉 In short: this script gives you a modular toolkit — sweeps, ChoCh confirmation, reentry signals, and structure narration — all adjustable so you can tailor the visuals to your workflow.
📈 Bullish Scenario Walkthrough
1. Market Context
• You’re watching the 5‑minute chart.
• Price has been consolidating near recent highs, building liquidity above.
2. Liquidity Sweep
• Price spikes above the prior swing high → the script detects a buy‑side sweep.
• A gold label appears: “BS Sweep + ChoCh” (if your ChoCh condition is true).
3. Change of Character (ChoCh)
• The candle closes bullish ().
• Your ChoCh condition confirms a structural shift.
• Together, sweep + ChoCh = potential reentry setup.
4. Reentry Trigger
• The script plots a green triangle below the bar.
• This marks a bullish sweep reentry signal: price grabbed liquidity and is now showing strength.
5. Market Structure Narration
• At the same time, the HH/HL labels update:
• The sweep bar prints a new HH.
• The next pivot low prints an HL.
• This narrates bullish continuation: HH → HL → HH.
6. Trade Decision
• You can use the green triangle as your entry cue.
• The HH/HL narration gives you confidence that structure supports the trade.
• Alerts can be set so you don’t miss the trigger.
7. Risk Management
• Stop placement: below the HL pivot or sweep low.
• Target: next liquidity pool above, or measured move.
🧭 How to Use This in Practice
• Gold label = liquidity event + ChoCh confirmation.
• Green triangle = actionable bullish reentry trigger.
• HH/HL narration = context for trend bias and trade management.
• Transparency slider = keep structure labels subtle so the chart stays clean.
📉 Bearish Scenario Walkthrough
1. Market Context
• You’re watching the 5‑minute chart.
• Price has been consolidating near recent lows, building liquidity underneath.
2. Liquidity Sweep
• Price spikes below the prior swing low → the script detects a sell‑side sweep.
• A gold label appears: “SS Sweep + ChoCh” (if your ChoCh condition is true).
3. Change of Character (ChoCh)
• The candle closes bearish ().
• Your ChoCh condition confirms a structural shift.
• Together, sweep + ChoCh = potential bearish reentry setup.
4. Reentry Trigger
• The script plots a red triangle above the bar.
• This marks a bearish sweep reentry signal: price grabbed liquidity below and is now showing weakness.
5. Market Structure Narration
• At the same time, the LH/LL labels update:
• The sweep bar prints a new LL.
• The next pivot high prints a LH.
• This narrates bearish continuation: LH → LL → LH.
6. Trade Decision
• You can use the red triangle as your entry cue.
• The LH/LL narration gives you confidence that structure supports the short.
• Alerts can be set so you don’t miss the trigger.
7. Risk Management
• Stop placement: above the LH pivot or sweep high.
• Target: next liquidity pool below, or measured move.
🧭 How to Use This in Practice
• Gold label = liquidity event + ChoCh confirmation.
• Red triangle = actionable bearish reentry trigger.
• LH/LL narration = context for trend bias and trade management.
• Transparency slider = keep structure labels subtle so the chart stays clean.

INSTITUTIONAL VOLUME PROFILE + FIBONACCI + ENHANCED SIGNALS🎯 INSTITUTIONAL VOLUME PROFILE + FIBONACCI + ENHANCED SIGNALS
A professional-grade indicator combining Volume Profile analysis, Fibonacci retracements, Anchored VWAP, and intelligent signal filtering to identify high-probability institutional positioning and trade setups.
📊 CORE FEATURES
▸ Volume Profile with POC (Point of Control)
- Visualizes where institutional volume accumulated
- Identifies High Volume Nodes (HVN) as key support/resistance
- Shows Value Area (70% volume zone) for market equilibrium
▸ Dynamic Fibonacci Levels
- Auto-detects swing high/low for retracement levels
- Golden Pocket (0.618-0.65) highlight zone
- Bull/bear direction recognition
▸ Anchored VWAP
- Anchored to swing range start
- Institutional mean reversion baseline
- Real-time trend bias indicator
▸ Graded Signal System (A+/B/C)
- A+ Signals: High probability setups (VWAP cross + POC alignment)
- B Signals: Above-average quality (VWAP cross above POC)
- C Signals: Lower probability (counter-trend setups)
🎮 DISPLAY MODES
⚡ TRADING LIVE MODE
- Clean chart showing only A+ signals
- Minimal visual noise for active trading
- Perfect for intraday execution
📈 FULL OVERVIEW MODE
- Complete analysis with all zones visible
- Volume Profile + Fibonacci + Value Area
- All signal grades displayed
- Statistics dashboard
🔬 ADVANCED SIGNAL FILTERS
✓ Volume Confirmation
- Requires above-average volume on signals
- Filters out weak institutional participation
- Configurable volume multiple (default 1.2x)
✓ Momentum Filter
- Ensures price momentum aligns with signal direction
- Prevents counter-trend entries
- Configurable lookback period
✓ SR Proximity Upgrade ⭐ GAME CHANGER
- Automatically upgrades B/C signals to A+ when near key levels
- Detects proximity to POC and HVN zones
- Combines technical confluence for best setups
🔔 SMART ALERTS
▸ Configurable alerts for A+, B, or C signals
▸ Real-time notifications to your device
▸ No need to watch charts constantly
▸ "Once per bar close" prevents repainting
💡 HOW TO USE
FOR DAY TRADING:
1. Switch to "Trading Live" mode
2. Enable only A+ alerts
3. Set filters: Volume 1.5x, Momentum ON, Proximity 0.3%
4. Trade only A+ signals at key levels
FOR SWING TRADING:
1. Use "Full Overview" mode
2. Analyze Value Area and Fibonacci confluence
3. Set filters: Volume 1.2x, Momentum ON, Proximity 0.8%
4. Enter on A+ signals with multi-timeframe confirmation
FOR ANALYSIS:
1. Full Overview mode with all visuals enabled
2. Disable filters to see all raw signals
3. Study how institutions positioned at key zones
4. Plan trades around POC and Value Area
⚙️ RECOMMENDED SETTINGS
5-15 MIN CHARTS (Scalping):
- Lookback: 200-300 bars
- Volume: 1.5x, Momentum: 5 bars, Proximity: 0.3%
- Trading Live mode + A+ alerts only
1 HOUR CHARTS (Intraday):
- Lookback: 300 bars
- Volume: 1.3x, Momentum: 3 bars, Proximity: 0.5%
- Full Overview or Trading Live
4 HOUR CHARTS (Swing):
- Lookback: 300-500 bars
- Volume: 1.2x, Momentum: 3 bars, Proximity: 0.8%
- Full Overview mode
DAILY CHARTS (Position):
- Lookback: 300-500 bars
- Volume: 1.1x, Momentum: 2 bars, Proximity: 1.0%
- Full Overview mode
📈 KEY CONCEPTS
POC (Point of Control): Price level with highest volume - acts as magnet
Value Area: Zone containing 70% of volume - equilibrium range
HVN: High Volume Nodes - institutional accumulation zones
AVWAP: Anchored VWAP - institutional average entry price
Golden Pocket: 0.618-0.65 Fib zone - highest probability reversal area
🎯 TRADING STRATEGY TIPS
1. Wait for A+ signals - quality over quantity
2. Best setups occur at POC or Value Area boundaries
3. Use multiple timeframes for confirmation
4. Combine with your own risk management rules
5. Signals are high probability, not guaranteed - always use stops

TrendlinesDowntrend lines are one of the most important tools in technical analysis. A downtrend line is created by connecting a series of lower highs which forms a clear visual line where price repeatedly finds resistance. Traders use these lines to understand trend direction, time entries, plan exits, and quickly recognize when momentum is shifting.
This indicator automatically finds and maintains the strongest downtrend lines on any timeframe. It removes the guesswork and inconsistency that comes with manually drawing trendlines.
Unlike most other trendline indicators that just draw lines from swing highs to the current high, this indicator actively scans for new pivot highs, tests each potential line against live price action and only promotes a line to valid status once it has proven itself as a true trendline by price touching or respecting the line a user defined number of times, with the default set to three. This filters out noise and leaves only the most meaningful and reliable trendlines on your chart.
When price eventually breaks a respected downtrend line the indicator highlights the breakout immediately. Traders often use these moments for entries confirmation signals or to prepare for a potential shift in market behavior. The breakout alert is built directly into the indicator so you never miss an important move.
This indicator also works with the Pine Screener to find tickers with current valid trendlines.
How are trendlines determined?
The indicator begins by anchoring to the most recent pivot high. From there it draws a temporary line to the current bar and evaluates every bar between the two points.
Each time a high comes within a user selected buffer zone around that line it is counted as a touch. Once the required number of touches is confirmed and price has never exceeded the buffer to the upside the trendline becomes valid and is displayed on the chart as an active downtrend line.

VV Moving Average Convergence Divergence # VMACDv3 - Volume-Weighted MACD with A/D Divergence Detection
## Overview
**VMACDv3** (Volume-Weighted Moving Average Convergence Divergence Version 3) is a momentum indicator that applies volume-weighting to traditional MACD calculations on price, while using the Accumulation/Distribution (A/D) line for divergence detection. This hybrid approach combines volume-weighted price momentum with volume distribution analysis for comprehensive market insight.
## Key Features
- **Volume-Weighted Price MACD**: Traditional MACD calculation on price but weighted by volume for earlier signals
- **A/D Divergence Detection**: Identifies when A/D trend diverges from MACD momentum
- **Volume Strength Filtering**: Distinguishes high-volume confirmations from low-volume noise
- **Color-Coded Histogram**: 4-color system showing momentum direction and volume strength
- **Real-Time Alerts**: Background colors and alert conditions for bullish/bearish divergences
## Difference from ACCDv3
| Aspect | VMACDv3 | ACCDv3 |
|--------|---------|---------|
| **MACD Input** | **Price (Close)** | **A/D Line** |
| **Volume Weighting** | Applied to price | Applied to A/D line |
| **Primary Signal** | Volume-weighted price momentum | Volume distribution momentum |
| **Use Case** | Price momentum with volume confirmation | Volume flow and accumulation/distribution |
| **Sensitivity** | More responsive to price changes | More responsive to volume patterns |
| **Best For** | Trend following, breakouts | Volume analysis, smart money tracking |
**Key Insight**: VMACDv3 shows *where price is going* with volume weight, while ACCDv3 shows *where volume is accumulating/distributing*.
## Components
### 1. Volume-Weighted MACD on Price
Unlike standard MACD that uses simple price EMAs, VMACDv3 weights each price by its corresponding volume:
```
Fast Line = EMA(Price × Volume, 12) / EMA(Volume, 12)
Slow Line = EMA(Price × Volume, 26) / EMA(Volume, 26)
MACD = Fast Line - Slow Line
```
**Benefits of Volume Weighting**:
- High-volume price movements have greater impact
- Filters out low-volume noise and false moves
- Provides earlier trend change signals
- Better reflects institutional activity
### 2. Accumulation/Distribution (A/D) Line
Used for divergence detection, measuring buying/selling pressure:
```
A/D = Σ ((2 × Close - Low - High) / (High - Low)) × Volume
```
- **Rising A/D**: Accumulation (buying pressure)
- **Falling A/D**: Distribution (selling pressure)
- **Doji Handling**: When High = Low, contribution is zero
### 3. Signal Lines
- **MACD Line** (Blue, #2962FF): The fast-slow difference showing momentum
- **Signal Line** (Orange, #FF6D00): EMA or SMA smoothing of MACD
- **Zero Line**: Reference for bullish (above) vs bearish (below) bias
### 4. Histogram Color System
The histogram uses 4 distinct colors based on **direction** and **volume strength**:
| Condition | Color | Meaning |
|-----------|-------|---------|
| Rising + High Volume | **Dark Green** (#1B5E20) | Strong bullish momentum with volume confirmation |
| Rising + Low Volume | **Light Teal** (#26A69A) | Bullish momentum but weak volume (less reliable) |
| Falling + High Volume | **Dark Red** (#B71C1C) | Strong bearish momentum with volume confirmation |
| Falling + Low Volume | **Light Pink** (#FFCDD2) | Bearish momentum but weak volume (less reliable) |
Additional shading:
- **Light Cyan** (#B2DFDB): Positive but not rising (momentum stalling)
- **Bright Red** (#FF5252): Negative and accelerating down
### 5. Divergence Detection
VMACDv3 compares A/D trend against volume-weighted price MACD:
#### Bullish Divergence (Green Background)
- **Condition**: A/D is trending up BUT MACD is negative and trending down
- **Interpretation**: Volume is accumulating while price momentum appears weak
- **Signal**: Smart money accumulation, potential bullish reversal
- **Action**: Look for long entries, especially at support levels
#### Bearish Divergence (Red Background)
- **Condition**: A/D is trending down BUT MACD is positive and trending up
- **Interpretation**: Volume is distributing while price momentum appears strong
- **Signal**: Smart money distribution, potential bearish reversal
- **Action**: Consider exits, avoid new longs, watch for breakdown
## Parameters
| Parameter | Default | Range | Description |
|-----------|---------|-------|-------------|
| **Source** | Close | OHLC/HLC3/etc | Price source for MACD calculation |
| **Fast Length** | 12 | 1-50 | Period for fast EMA (shorter = more sensitive) |
| **Slow Length** | 26 | 1-100 | Period for slow EMA (longer = smoother) |
| **Signal Smoothing** | 9 | 1-50 | Period for signal line (MACD smoothing) |
| **Signal Line MA Type** | EMA | SMA/EMA | Moving average type for signal calculation |
| **Volume MA Length** | 20 | 5-100 | Period for volume average (strength filter) |
## Usage Guide
### Reading the Indicator
1. **MACD Lines (Blue & Orange)**
- **Blue Line (MACD)**: Volume-weighted price momentum
- **Orange Line (Signal)**: Smoothed trend of MACD
- **Crossovers**: Blue crosses above orange = bullish, below = bearish
- **Distance**: Wider gap = stronger momentum
- **Zero Line Position**: Above = bullish bias, below = bearish bias
2. **Histogram Colors**
- **Dark Green (#1B5E20)**: Strong bullish move with high volume - **most reliable buy signal**
- **Light Teal (#26A69A)**: Bullish but low volume - wait for confirmation
- **Dark Red (#B71C1C)**: Strong bearish move with high volume - **most reliable sell signal**
- **Light Pink (#FFCDD2)**: Bearish but low volume - may be temporary dip
3. **Background Divergence Alerts**
- **Green Background**: A/D accumulating while price weak - potential bottom
- **Red Background**: A/D distributing while price strong - potential top
- Most powerful at key support/resistance levels
### Trading Strategies
#### Strategy 1: Volume-Confirmed Trend Following
1. Wait for MACD to cross above zero line
2. Look for **dark green** histogram bars (high volume confirmation)
3. Enter long on second consecutive dark green bar
4. Hold while histogram remains green
5. Exit when histogram turns light green or red appears
6. Set stop below recent swing low
**Example**:
```
Price: 26,400 → 26,450 (rising)
MACD: -50 → +20 (crosses zero)
Histogram: Light teal → Dark green → Dark green
Volume: 50k → 75k → 90k (increasing)
```
#### Strategy 2: Divergence Reversal Trading
1. Identify divergence background (green = bullish, red = bearish)
2. Confirm with price structure (support/resistance, chart patterns)
3. Wait for MACD to cross signal line in divergence direction
4. Enter on first **dark colored** histogram bar after divergence
5. Set stop beyond divergence area
6. Target previous swing high/low
**Example - Bullish Divergence**:
```
Price: Making lower lows (26,350 → 26,300 → 26,250)
A/D: Rising (accumulation)
MACD: Below zero but starting to curve up
Background: Green shading appears
Entry: MACD crosses signal line + dark green bar
Stop: Below 26,230
Target: 26,450 (previous high)
```
#### Strategy 3: Momentum Scalping
1. Trade only in direction of MACD zero line (above = long, below = short)
2. Enter on dark colored bars only
3. Exit on first light colored bar or opposite color
4. Quick in and out (1-5 minute holds)
5. Tight stops (0.2-0.5% depending on instrument)
#### Strategy 4: Histogram Pattern Trading
**V-Bottom Reversal (Bullish)**:
- Red histogram bars start rising (becoming less negative)
- Forms "V" shape at the bottom
- Transitions to light red → light teal → **dark green**
- Entry: First dark green bar
- Signal: Momentum reversal with volume
**Λ-Top Reversal (Bearish)**:
- Green histogram bars start falling (becoming less positive)
- Forms inverted "V" at the top
- Transitions to light green → light pink → **dark red**
- Entry: First dark red bar
- Signal: Momentum exhaustion with volume
### Multi-Timeframe Analysis
**Recommended Approach**:
1. **Higher Timeframe (15m/1h)**: Identify overall trend direction
2. **Trading Timeframe (5m)**: Time entries using VMACDv3 signals
3. **Lower Timeframe (1m)**: Fine-tune entry prices
**Example Setup**:
```
15-minute: MACD above zero (bullish bias)
5-minute: Dark green histogram appears after pullback
1-minute: Enter on break of recent high with volume
```
### Volume Strength Interpretation
The volume filter compares current volume to 20-period average:
- **Volume > Average**: Dark colors (green/red) - high confidence signals
- **Volume < Average**: Light colors (teal/pink) - lower confidence signals
**Trading Rules**:
- ✓ **Aggressive**: Take all dark colored signals
- ✓ **Conservative**: Only take dark colors that follow 2+ light colors of same type
- ✗ **Avoid**: Trading light colored signals during high volatility
- ✗ **Avoid**: Ignoring volume context during news events
## Technical Details
### Volume-Weighted Calculation
```pine
// Volume-weighted fast EMA
fast_ma = ta.ema(src * volume, fast_length) / ta.ema(volume, fast_length)
// Volume-weighted slow EMA
slow_ma = ta.ema(src * volume, slow_length) / ta.ema(volume, slow_length)
// MACD is the difference
macd = fast_ma - slow_ma
// Signal line smoothing
signal = ta.ema(macd, signal_length) // or ta.sma() if SMA selected
// Histogram
hist = macd - signal
```
### Divergence Detection Logic
```pine
// A/D trending up if above its 5-period SMA
ad_trend = ad > ta.sma(ad, 5)
// MACD trending up if above zero
macd_trend = macd > 0
// Divergence when trends oppose each other
divergence = ad_trend != macd_trend
// Specific conditions for alerts
bullish_divergence = ad_trend and not macd_trend and macd < 0
bearish_divergence = not ad_trend and macd_trend and macd > 0
```
### Histogram Coloring Logic
```pine
hist_color = (hist >= 0
? (hist < hist
? (vol_strength ? #1B5E20 : #26A69A) // Rising: dark/light green
: #B2DFDB) // Positive but falling: cyan
: (hist < hist
? (vol_strength ? #B71C1C : #FFCDD2) // Rising (less negative): dark/light red
: #FF5252)) // Falling more: bright red
```
## Alerts
Built-in alert conditions for divergence detection:
### Bullish Divergence Alert
- **Trigger**: A/D trending up, MACD negative and trending down
- **Message**: "Bullish Divergence: A/D trending up but MACD trending down"
- **Use Case**: Potential reversal or continuation after pullback
- **Action**: Look for long entry setups
### Bearish Divergence Alert
- **Trigger**: A/D trending down, MACD positive and trending up
- **Message**: "Bearish Divergence: A/D trending down but MACD trending up"
- **Use Case**: Potential top or trend reversal
- **Action**: Consider exits or short entries
### Setting Up Alerts
1. Click "Create Alert" in TradingView
2. Condition: Select "VMACDv3"
3. Choose alert type: "Bullish Divergence" or "Bearish Divergence"
4. Configure: Email, SMS, webhook, or popup
5. Set frequency: "Once Per Bar Close" recommended
## Comparison Tables
### VMACDv3 vs Standard MACD
| Feature | Standard MACD | VMACDv3 |
|---------|---------------|---------|
| **Price Weighting** | Equal weight all bars | Volume-weighted |
| **Sensitivity** | Fixed | Adaptive to volume |
| **False Signals** | More during low volume | Fewer (volume filter) |
| **Divergence** | Price vs MACD | A/D vs MACD |
| **Volume Analysis** | None | Built-in |
| **Color System** | 2 colors | 4+ colors |
| **Best For** | Simple trend following | Volume-confirmed trading |
### VMACDv3 vs ACCDv3
| Aspect | VMACDv3 | ACCDv3 |
|--------|---------|--------|
| **Focus** | Price momentum | Volume distribution |
| **Reactivity** | Faster to price moves | Faster to volume shifts |
| **Best Markets** | Trending, breakouts | Accumulation/distribution phases |
| **Signal Type** | Where price + volume going | Where smart money positioning |
| **Divergence Meaning** | Volume vs price disagreement | A/D vs momentum disagreement |
| **Use Together?** | ✓ Yes, complementary | ✓ Yes, different perspectives |
## Example Trading Scenarios
### Scenario 1: Strong Bullish Breakout
```
Time: 9:30 AM (market open)
Price: Breaks above 26,400 resistance
MACD: Crosses above zero line
Histogram: Dark green bars (#1B5E20)
Volume: 2x average (150k vs 75k avg)
A/D: Rising (no divergence)
Action: Enter long at 26,405
Stop: 26,380 (below breakout)
Target 1: 26,450 (risk:reward 1:2)
Target 2: 26,500 (risk:reward 1:4)
Result: High probability setup with volume confirmation
```
### Scenario 2: False Breakout (Avoided)
```
Time: 2:30 PM (slow period)
Price: Breaks above 26,400 resistance
MACD: Slightly positive
Histogram: Light teal bars (#26A69A)
Volume: 0.5x average (40k vs 75k avg)
A/D: Flat/declining
Action: Avoid trade
Reason: Low volume, no conviction, potential false breakout
Outcome: Price reverses back below 26,400 within 10 minutes
Saved: Avoided losing trade due to volume filter
```
### Scenario 3: Bullish Divergence Bottom
```
Time: 11:00 AM
Price: Making lower lows (26,350 → 26,300 → 26,280)
MACD: Below zero but curving upward
Histogram: Red bars getting shorter (V-bottom forming)
Background: Green shading (divergence alert)
A/D: Rising despite price falling
Volume: Increasing on down bars
Setup:
1. Divergence appears at 26,280 (green background)
2. Wait for MACD to cross signal line
3. First dark green bar appears at 26,290
4. Enter long: 26,295 (next bar open)
5. Stop: 26,265 (below divergence low)
6. Target: 26,350 (previous swing high)
Result: +55 points (30 point risk, 1.8:1 reward)
Key: Divergence + volume confirmation = high probability reversal
```
### Scenario 4: Bearish Divergence Top
```
Time: 1:45 PM
Price: Making higher highs (26,500 → 26,520 → 26,540)
MACD: Positive but flattening
Histogram: Green bars getting shorter (Λ-top forming)
Background: Red shading (bearish divergence)
A/D: Declining despite rising price
Volume: Decreasing on up bars
Setup:
1. Bearish divergence at 26,540 (red background)
2. MACD crosses below signal line
3. First dark red bar appears at 26,535
4. Enter short: 26,530
5. Stop: 26,555 (above divergence high)
6. Target: 26,475 (support level)
Result: +55 points (25 point risk, 2.2:1 reward)
Key: Distribution while price rising = smart money exiting
```
### Scenario 5: V-Bottom Reversal
```
Downtrend in progress
MACD: Deep below zero (-150)
Histogram: Series of dark red bars
Pattern Development:
Bar 1: Dark red, hist = -80, falling
Bar 2: Dark red, hist = -95, falling
Bar 3: Dark red, hist = -100, falling (extreme)
Bar 4: Light pink, hist = -98, rising!
Bar 5: Light pink, hist = -90, rising
Bar 6: Light teal, hist = -75, rising (crosses to positive momentum)
Bar 7: Dark green, hist = -55, rising + volume
Action: Enter long on Bar 7
Reason: V-bottom confirmed with volume
Stop: Below Bar 3 low
Target: Zero line on histogram (mean reversion)
```
## Best Practices
### Entry Rules
✓ **Wait for dark colors**: High-volume confirmation is key
✓ **Confirm divergences**: Use with price support/resistance
✓ **Trade with zero line**: Long above, short below for best odds
✓ **Multiple timeframes**: Align 1m, 5m, 15m signals
✓ **Watch for patterns**: V-bottoms and Λ-tops are reliable
### Exit Rules
✓ **Partial profits**: Take 50% at first target
✓ **Trail stops**: Use histogram color changes
✓ **Respect signals**: Exit on opposite dark color
✓ **Time stops**: Close positions before major news
✓ **End of day**: Square up before close
### Avoid
✗ **Don't chase light colors**: Low volume = low confidence
✗ **Don't ignore divergence**: Early warning system
✗ **Don't overtrade**: Wait for clear setups
✗ **Don't fight the trend**: Zero line dictates bias
✗ **Don't skip stops**: Always use risk management
## Risk Management
### Position Sizing
- **Dark green/red signals**: 1-2% account risk
- **Light signals**: 0.5% account risk or skip
- **Divergence plays**: 1% account risk (higher uncertainty)
- **Multiple confirmations**: Up to 2% account risk
### Stop Loss Placement
- **Trend trades**: Below/above recent swing (20-30 points typical)
- **Breakout trades**: Below/above breakout level (15-25 points)
- **Divergence trades**: Beyond divergence extreme (25-40 points)
- **Scalp trades**: Tight stops at 10-15 points
### Profit Targets
- **Minimum**: 1.5:1 reward to risk ratio
- **Scalps**: 15-25 points (quick in/out)
- **Swing**: 50-100 points (hold through pullbacks)
- **Runners**: Trail with histogram color changes
## Timeframe Recommendations
| Timeframe | Trading Style | Typical Hold | Advantages | Challenges |
|-----------|---------------|--------------|------------|------------|
| **1-minute** | Scalping | 1-5 minutes | Fast profits, many setups | Noisy, high false signals |
| **5-minute** | Intraday | 15-60 minutes | Balance of speed/clarity | Still requires quick decisions |
| **15-minute** | Swing | 1-4 hours | Clearer trends, less noise | Fewer opportunities |
| **1-hour** | Position | 4-24 hours | Strong signals, less monitoring | Wider stops required |
**Recommendation**: Start with 5-minute for best balance of signal quality and opportunity frequency.
## Combining with Other Indicators
### VMACDv3 + ACCDv3
- **Use**: Confirm volume flow with price momentum
- **Signal**: Both showing dark green = highest conviction long
- **Divergence**: VMACDv3 bullish + ACCDv3 bearish = examine price action
### VMACDv3 + RSI
- **Use**: Overbought/oversold with momentum confirmation
- **Signal**: RSI < 30 + dark green VMACD = strong reversal
- **Caution**: RSI > 70 + light green VMACD = potential false breakout
### VMACDv3 + Elder Impulse
- **Use**: Bar coloring + histogram confirmation
- **Signal**: Green Elder bars + dark green VMACD = aligned momentum
- **Exit**: Blue Elder bars + light colors = momentum stalling
## Limitations
- **Requires volume data**: Will not work on instruments without volume feed
- **Lagging indicator**: MACD inherently follows price (2-3 bar delay)
- **Consolidation noise**: Generates false signals in tight ranges
- **Gap handling**: Large gaps can distort volume-weighted values
- **Not standalone**: Should combine with price action and support/resistance
## Troubleshooting
**Problem**: Too many light colored signals
**Solution**: Increase Volume MA Length to 30-40 for stricter filtering
**Problem**: Missing entries due to waiting for dark colors
**Solution**: Lower Volume MA Length to 10-15 for more signals (accept lower quality)
**Problem**: Divergences not appearing
**Solution**: Verify volume data available; check if A/D line is calculating
**Problem**: Histogram colors not changing
**Solution**: Ensure real-time data feed; refresh indicator
## Version History
- **v3**: Removed traditional MACD, using volume-weighted MACD on price with A/D divergence
- **v2**: Added A/D divergence detection, volume strength filtering, enhanced histogram colors
- **v1**: Basic volume-weighted MACD on price
## Related Indicators
**Companion Tools**:
- **ACCDv3**: Volume-weighted MACD on A/D line (distribution focus)
- **RSIv2**: RSI with A/D divergence detection
- **DMI**: Directional Movement Index with A/D divergence
- **Elder Impulse**: Bar coloring system using volume-weighted MACD
**Use Together**: VMACDv3 (momentum) + ACCDv3 (distribution) + Elder Impulse (bar colors) = complete volume-based trading system
---
*This indicator is for educational purposes. Past performance does not guarantee future results. Always practice proper risk management and never risk more than you can afford to lose.*

Fibonacci Zones and RejectionsThis tool combines swing structure, Fibonacci retracements and candle-wick rejection logic to highlight high-probability reversal or continuation zones.
What it does
Tracks market structure automatically
Detects swing highs and swing lows based on a user-defined Structure Period.
Marks bullish shifts in structure and bearish shifts with CHoCH labels and Break of Structure (BoS) lines.
Optionally draws a dotted swing trend line between the active swing high and swing low and can show price labels at those swing points.
Draws dynamic Fibonacci retracements on the latest swing
Automatically anchors a Fibonacci retracement between the current swing high and swing low.
Lets you enable/disable individual Fibonacci levels and customize their values, colors and line width.
Can extend Fib levels forward to the latest bar and optionally keep previous Fib structures on the chart for context.
Optionally fills the “Golden Zone” (by default the first two levels, e.g. 0.50 and 0.618) so the core pullback area is visually obvious.
Defines an OTE / “Gold Zone” band from the active Fib levels
Uses the first two Fib lines (by default 0.50 and 0.618 or set another zone such as 61.8% to 78.6%) to form a live “Optimal Trade Entry” band.
Continuously updates this band as new structure forms and swings develop.
Detects rejection candles inside the Fib OTE band
Breaks each candle into upper wick, lower wick, body and total range.
A bullish rejection is a candle where:
Price trades into the OTE band,
The lower wick is a large portion of the bar’s range, and
The body is not tiny (minimum body-to-range ratio is configurable).
A bearish rejection is the mirror condition using the upper wick.
Only candles whose range overlaps the OTE band are considered; this filters for true reactions to the Fib zone.
Plots clear signals and alerts
Bullish OTE rejection is plotted as a large cross at the low of the candle.
Bearish OTE rejection is plotted as a large cross at the high of the candle.
Built-in alertcondition calls allow you to set alerts for:
Bullish OTE Rejection
Bearish OTE Rejection
Optional “debug” markers can show all raw rejection candles and all bars that sit inside the OTE band, to help you understand how the logic behaves.
Use cases
Identify pullback entries into the desired Fib zone after a clear structural move.
Confirm reversals or continuations using wick-based rejection inside a pre-defined Fib discount/premium zone.
Combine with your own higher-timeframe bias or ICT / SMC tools to refine entry timing around key levels.

Simulated Liquidation Heatmap [QuantAlgo]🟢 Overview
This indicator visualizes where clusters of stop-loss orders and liquidation levels are likely located, displayed as a 'heatmap'. It's based on the concept of market structure liquidity: large groups of stop orders tend to gather around obvious technical levels (like swing highs and lows), and these pools of orders often attract price movement from institutional traders. The indicator uses a fractal-based algorithm to identify these high-probability liquidation zones and displays them as dynamic, color-coded boxes.
The key feature is the thermal color gradient, which indicates the freshness (age) and therefore the relative relevance of the liquidity zone. Hot colors (e.g., Red/Yellow) represent fresh clusters that have just formed, suggesting strong and immediate liquidity interest. Cold colors (e.g., Blue/Purple) represent aged or decaying clusters that are becoming less relevant over time. This visualization allows traders to anticipate potential liquidity sweeps (stop hunts) and understand areas of significant retail and institutional positioning.
🟢 Key Features
1. Liquidity Zone Heatmap
The core function is the identification of swing high and swing low price points using a user-defined Lookback period. These points are where retail traders are statistically most likely to place their stop-loss orders. The indicator simulates the clustering of these orders by drawing a zone (box) around the detected swing point, with the vertical size controlled by the Stop/Liquidation Zone Width (%) setting.
▶ Cluster Lookback: Defines the sensitivity of swing point detection. Lower values detect frequent, minor zones (scalping/intraday); higher values detect major, stronger swing points (swing trading).
▶ Zone Width (%): Sets the percentage range above and below the swing point where stops are simulated to cluster, accounting for slippage and typical stop placement spread.
▶ Liquidity Decay: Zones gradually fade in color intensity and are eventually removed after the user-defined Liquidity Decay Period (Bars), ensuring the heatmap only displays relevant, current liquidity areas.
▶ Round Number Filter: An optional filter that limits the display to liquidity zones occurring only at psychologically significant round numbers (e.g., $100, $1,500.00), which typically attract higher concentrations of orders.
2. Thermal Color Gradient
The heatmap's color is a direct function of the zone's age, providing a visual proxy for immediate relevance.
▶ Freshness: Newly created zones are displayed in the Hot Color (high relevance).
▶ Decay: As bars pass, the zone color transitions along the gradient toward the Cold Color and increased transparency (lower relevance), until it is removed entirely.
▶ Color Schemes: Multiple pre-configured and custom color schemes are available to optimize the visualization for different chart themes and color preferences.
3. Liquidity Heat Thermometer
An optional visual thermometer is displayed on the chart to provide an instant, overall assessment of the current liquidation heat level in the immediate vicinity of the price.
▶ Calculation: The thermometer calculates an aggregate heat score based on the age and proximity of all liquidity zones within a user-defined Zone Detection Range (%) of the current price.
▶ Visual Feedback: A marker (triangle) points to the corresponding level on the thermometer's color gradient (Hot to Cold). A high reading indicates price is close to fresh, dense stop clusters, suggesting high volatility or an imminent liquidity sweep is probable. A low reading indicates price is in a low-density or aged liquidity area.
▶ Customization: The thermometer's resolution, position, and text size are fully customizable for optimal chart placement and readability.
🟢 Practical Applications
▶ Anticipate Sweeps: Prioritize trading in the direction of Hot (fresh) liquidity zones. For example, a hot low-side zone suggests strong sell-side liquidity (stop-losses) is available for large buyers to sweep.
▶ Filter Noise: Use the Round Number Filter to focus only on the highest probability liquidation zones, which are often at clean, psychological price levels.
▶ Validate Entries: Combine the Heat Thermometer with price action analysis. A rising heat level indicates increasing proximity to a major stop cluster, signaling a potential turn or an aggressive market move to sweep those stops.
▶ Risk Management: Understand that price often acts dynamically around these zones. High heat levels imply high risk/reward setups; stops should be placed strategically beyond the defined Liquidation Zone Width.
▶ Multi-Timeframe Context: Higher timeframes (e.g., Daily, 4-Hour) often reveal more significant, major liquidity zones. Use this indicator on lower timeframes (e.g., 5-min, 15-min) for execution, but prioritize zones that align with higher-timeframe structures.

Fibonacci Projection with Volume & Delta Profile (Zeiierman)█ Overview
Fibonacci Projection with Volume & Delta Profile (Zeiierman) blends classic Fibonacci swing analysis with modern volume-flow reading to create a unified, projection-based market framework. The indicator automatically detects the latest swing high and swing low, builds a complete Fibonacci structure, and then projects future extension targets with clear visual pathways.
What makes this tool unique is the integration of two volume-based systems directly into the Fibonacci structure. A Fib-aligned Volume Profile shows how bullish and bearish volume accumulated inside the swing range, while a separate Delta Profile reveals the imbalance of buy–sell pressure inside each Fibonacci interval. Together, these elements transform the standard Fibonacci tool into a multi-dimensional structural and volume-flow map.
█ How It Works
The indicator first detects the most recent swing high and swing low using the Period setting. That swing defines the Fibonacci range, from which the script draws retracement levels (0.236–0.786) and builds a forward projection path using the chosen Projection Level and a 1.272 extension.
Along this path, it draws projection lines, target boxes, and percentage labels that show how far each projected leg extends relative to the previous one.
Inside the same swing range, the script builds a Fib-based Volume Profile by splitting price into rows and assigning each bar’s volume as bullish (close > open) or bearish (close ≤ open). On top of that, it calculates a Volume Delta Profile between each pair of fib levels, showing whether buyers or sellers dominated that band and how strong that imbalance was.
█ How to Use
This tool helps traders quickly understand market structure and where the price may be heading next. The projection engine shows the most likely future targets, highlights strong or weak legs in the move, and updates automatically whenever a new swing forms. This ensures you always see the most relevant and up-to-date projection path.
The Fib Volume Profile shows where volume supported the move and where it did not. Thick bullish buckets reveal zones where buyers stepped in aggressively, often becoming retestable support. Thick bearish buckets highlight zones of resistance or rejection, particularly useful if projected levels align with prior liquidity.
The Delta Profile adds a second dimension to volume reading by showing where buy–sell pressure was truly imbalanced. A projected Fibonacci target that aligns with a strong bullish delta, for example, may suggest continuation. A projection into a band dominated by bearish delta may warn of reversal or hesitation.
█ Settings
Period – bars used to determine swing high/low
Projection Level – chosen Fib ratio for projection path
-----------------
Disclaimer
The content provided in my scripts, indicators, ideas, algorithms, and systems is for educational and informational purposes only. It does not constitute financial advice, investment recommendations, or a solicitation to buy or sell any financial instruments. I will not accept liability for any loss or damage, including without limitation any loss of profit, which may arise directly or indirectly from the use of or reliance on such information.
All investments involve risk, and the past performance of a security, industry, sector, market, financial product, trading strategy, backtest, or individual's trading does not guarantee future results or returns. Investors are fully responsible for any investment decisions they make. Such decisions should be based solely on an evaluation of their financial circumstances, investment objectives, risk tolerance, and liquidity needs.

Trend Follow Line Point📌 Trend Follow Line Point
The Trend Follow Line Point indicator removes the confusing, repainting-based swing connections commonly found in traditional swing tools.
It maintains consistent swing-point calculation, keeps structural swing lines intact even when trend lines are broken, and integrates market structure + trend + volatility + volume into one intuitive, visual indicator.
This tool is designed for:
Trend Following
Swing Structure Analysis
Volatility-Based Entry & Exit
Market Strength Evaluation
📊 Component Explanation
🔹 1. Swing High / Swing Low Detection
Based on the user-defined sensitivity (swgLen):
A Swing High forms when the current high exceeds the previous swgLen highs.
A Swing Low forms when the current low falls below the previous swgLen lows.
🔹 2. Swing-Based Structure Lines
Connect Swing Highs → Structural visualization
Connect Swing Lows → Structural visualization
These lines reveal the underlying market structure without repainting or disappearing unexpectedly.
🔹 3. Dynamic ATR + Volume Weighting
ATR values combined with the volume ratio (vol / volMA) create a dynamic volatility channel that reflects real-time market pressure.
🔹 4. Enhanced SuperTrend Calculation
Uses ATR-based stability to produce more realistic and smoother trend lines, reducing noise and improving signal clarity.
🔹 5. Trend Color Mapping
Up Trend → User-selected color
Down Trend → User-selected color
Visual trend direction and strength can be identified immediately.
🧭 How to Use
When Swing Highs/Lows are detected, structure lines are automatically drawn between previous swings.
Use these lines to evaluate support/resistance breaks and overall structural direction.
Manage risk with volatility guidance:
Higher ATR (volume-weighted) → wider trend spacing → increased risk
Lower ATR → tighter spacing → reduced risk
This helps with position sizing, entry timing, and exit decisions.
+
